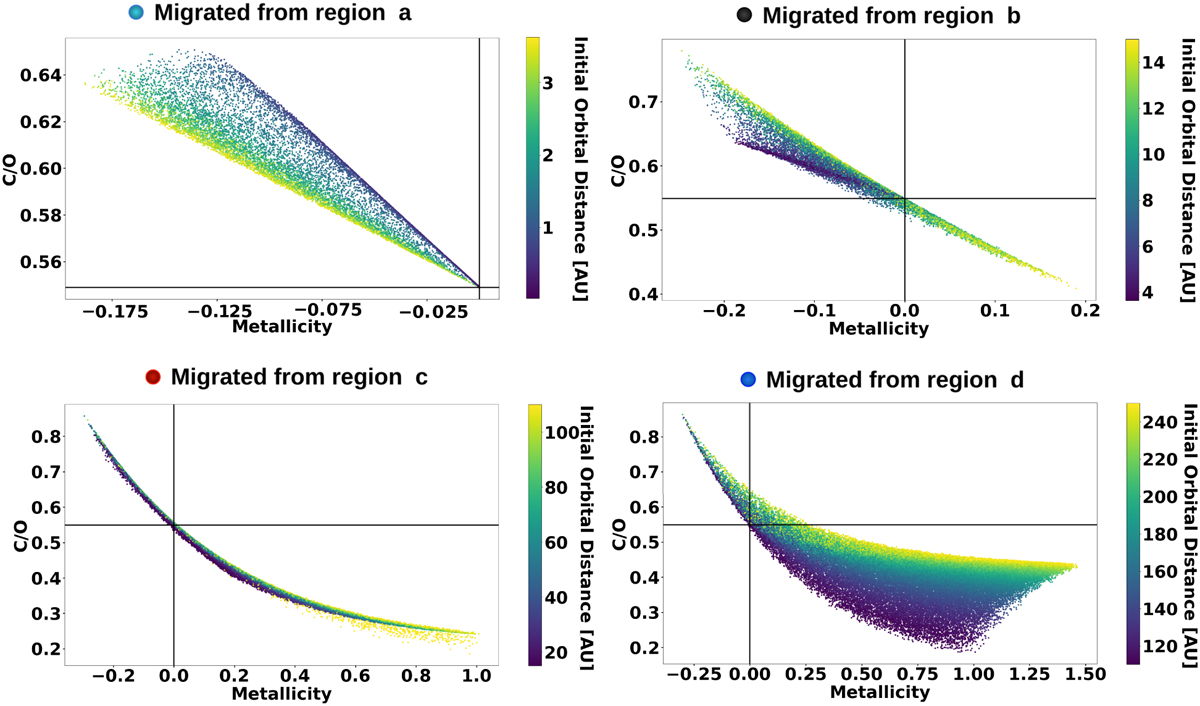
Fig. 7
Download original image
C/O ratio and the log scale metallicity of the planets formed by SimAb and presented in Fig. 5. The color bar indicates the initial core orbital distances of these planets. Shown are zoom-ins on the four regions explained in Fig. 5. Top left panel: planets that initiate their formation in region A; in this region the planets that initiate their formation farther out would end up with a lower C/O ratio. Top right panel: planets that initiate their formation in region B; in this region planets with subsolar metallicity that are formed farther out have higher C/O ratios. Additionally, only planets that are formed closer to the CO2 ice line show supersolar metallicity. Bottom left panel: planets that initiate their formation in region C; given planets with the same metallicity, planets that initiate their formation farther out have a higher C/O ratio. Bottom right panel: planets that initiate their formation in region D; planets with supersolar metallicity show C/O ratios closer to the solar value as the planet initiates its formation farther out. Planets with supersolar metallicity can reach higher metallicities when initiating their formation farther out.
Current usage metrics show cumulative count of Article Views (full-text article views including HTML views, PDF and ePub downloads, according to the available data) and Abstracts Views on Vision4Press platform.
Data correspond to usage on the plateform after 2015. The current usage metrics is available 48-96 hours after online publication and is updated daily on week days.
Initial download of the metrics may take a while.