Fig. 6
Download original image
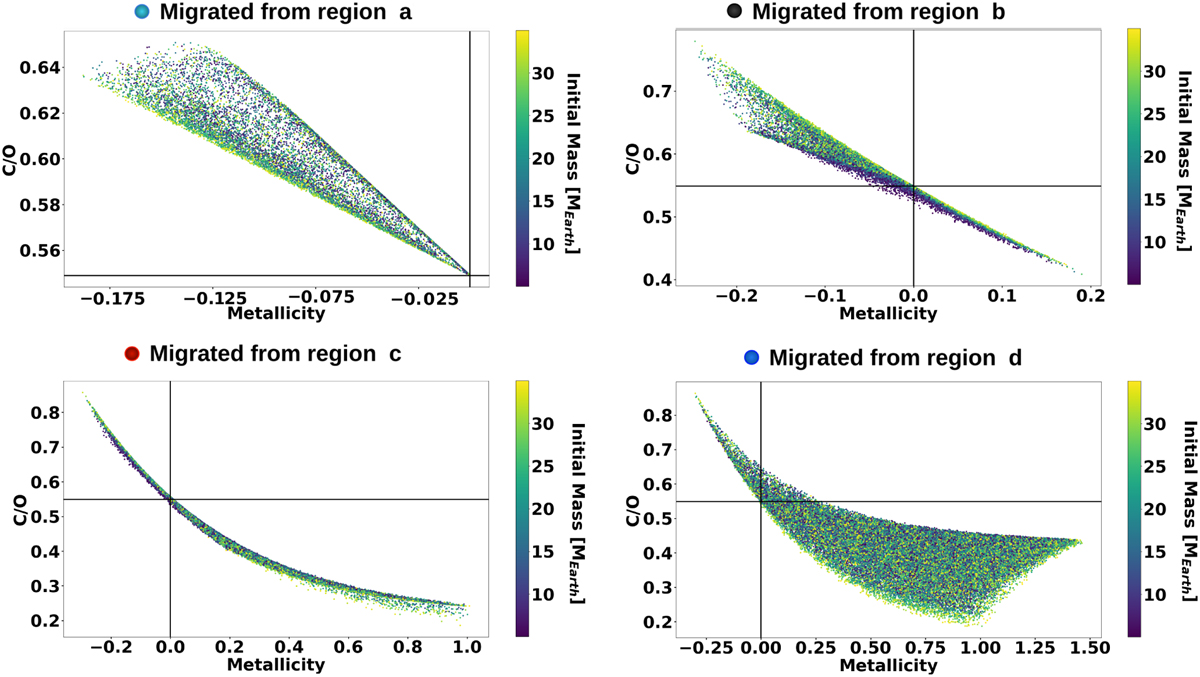
C/O ratio and the log scale metallicity of the planets formed by the model and presented in Fig. 5. The color bar indicates the initial core mass of these planets. Shown are zoom-ins on the four regions explained in Fig. 5. The top left panel shows planets that initiate their formation in region A, the top right panel shows planets that initiate their formation in region B, the bottom left panel shows planets that initiate their formation in region C, and the bottom right panel shows planets that initiated their migration from region D. In all four panels there is no clear correlation between the C/O ratio and the metallicity of the planetary atmospheres and their initial core mass.
Current usage metrics show cumulative count of Article Views (full-text article views including HTML views, PDF and ePub downloads, according to the available data) and Abstracts Views on Vision4Press platform.
Data correspond to usage on the plateform after 2015. The current usage metrics is available 48-96 hours after online publication and is updated daily on week days.
Initial download of the metrics may take a while.