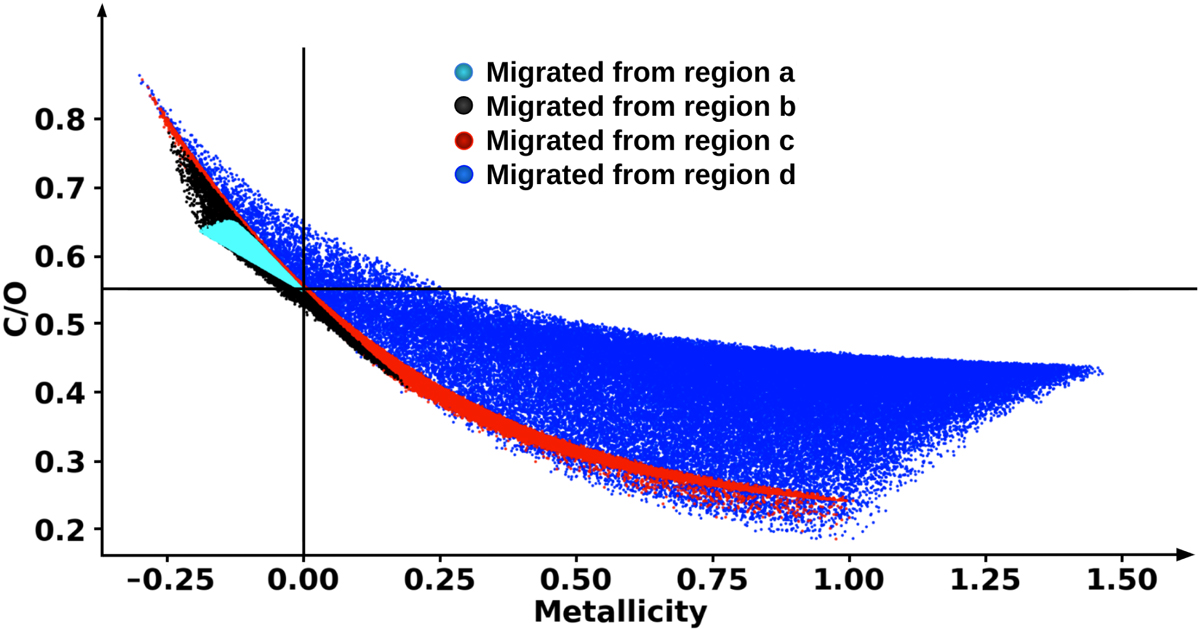
Fig. 5
Download original image
C/O ratio and the log scale of metallicity of 100 thousand planets with one Jupiter mass at a distance of 0.02 AU with different compositions. The different compositions are caused by the different formation initial conditions (see Sect. 3). The four different colors show planets that initiated their formation in four different regions of the disk. Cyan indicates planets that initiated their migration within the water ice line, region A. Black indicates planets that initiated their migration farther than the water ice line and within the CO2 ice line, region B. Red indicates planets that initiated their migration beyond the CO2 ice line and within the CO ice line, region C. Blue indicates planets that initiated their migration farther than the CO ice line, region D.
Current usage metrics show cumulative count of Article Views (full-text article views including HTML views, PDF and ePub downloads, according to the available data) and Abstracts Views on Vision4Press platform.
Data correspond to usage on the plateform after 2015. The current usage metrics is available 48-96 hours after online publication and is updated daily on week days.
Initial download of the metrics may take a while.