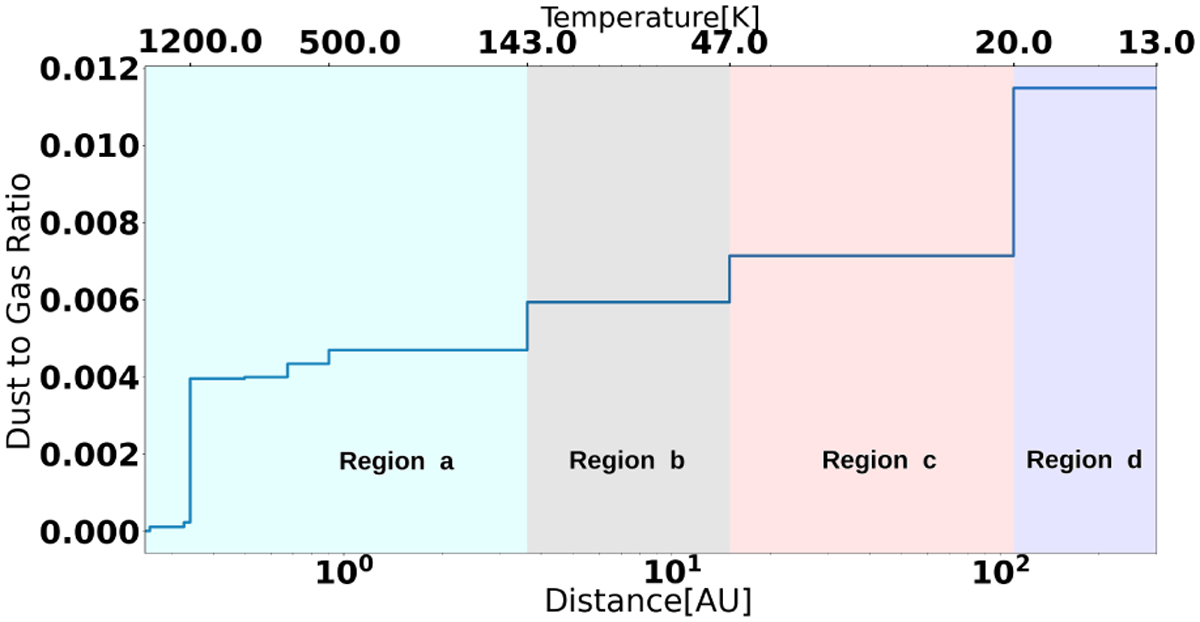
Fig. 2
Download original image
Dust-to-gas ratio calculated by abundance module based on the amount of atoms in the solid and gas phase. This plot shows how the dust-to-gas ratio changes throughout the disk. The steps in the plot are caused by the condensation of different species mentioned in Table 1. The colors in the plot indicate different regions in the disk. Cyan indicates region A, and shows the disk within the water ice line. Black indicates region B, and shows the disk farther than the water ice line and within the CO2 ice line. Red indicates region C, and shows the disk between the CO2 ice line and CO ice line. Blue indicates region D, and shows the disk farther than the CO ice line.
Current usage metrics show cumulative count of Article Views (full-text article views including HTML views, PDF and ePub downloads, according to the available data) and Abstracts Views on Vision4Press platform.
Data correspond to usage on the plateform after 2015. The current usage metrics is available 48-96 hours after online publication and is updated daily on week days.
Initial download of the metrics may take a while.