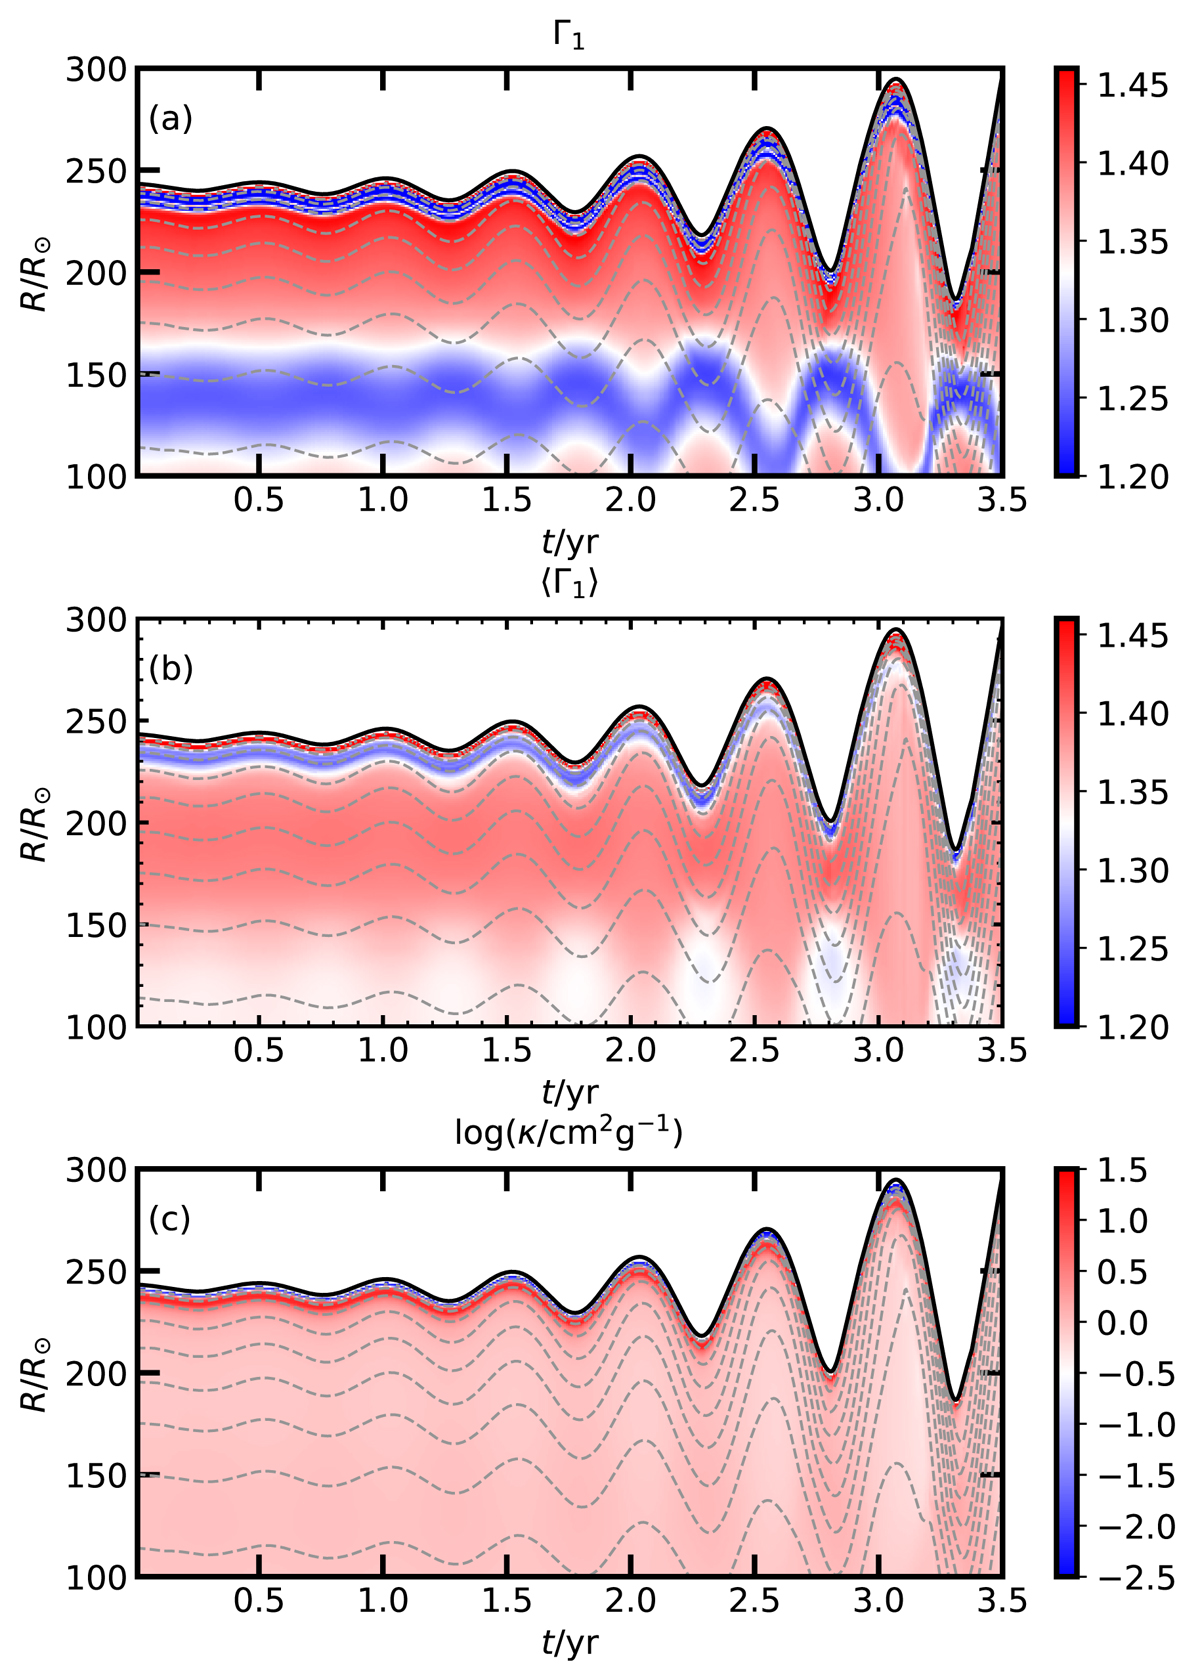
Fig. 8.
Download original image
Amplitude-increasing phase in the model with an envelope of 0.004 M⊙, showing the first adiabatic exponent, the pressure-weighted volume-averaged value of the first adiabatic exponent, and the opacity. The white color corresponds to the critical value of 4/3 in panels a and b. The dashed lines give the contours containing 90, 80, 70, 60, 50, 40, 30, 20, and 10% of the envelope mass.
Current usage metrics show cumulative count of Article Views (full-text article views including HTML views, PDF and ePub downloads, according to the available data) and Abstracts Views on Vision4Press platform.
Data correspond to usage on the plateform after 2015. The current usage metrics is available 48-96 hours after online publication and is updated daily on week days.
Initial download of the metrics may take a while.