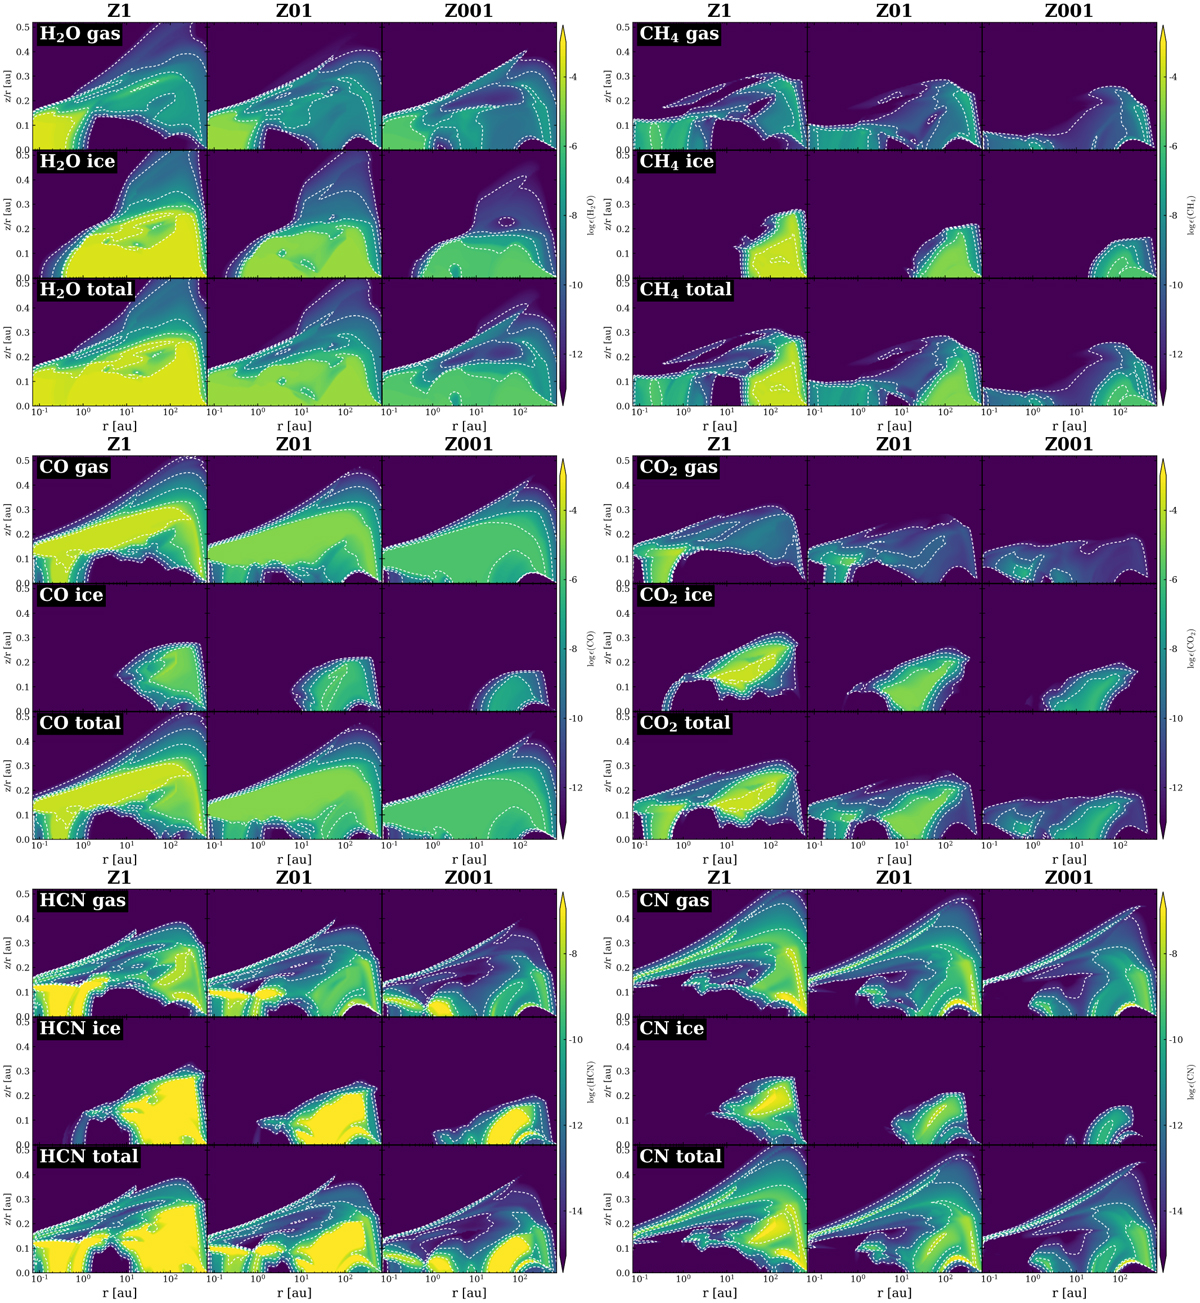
Fig. 7
Download original image
Contour plots of the abundances. From left to right and top to bottom: H2O, CH4, CO, CO2, HCN, and CN are represented relative to the total hydrogen nuclei number density. The dashed contour lines describe the tick values on the colorbar. The left column corresponds to model Z1. The middle column corresponds to the model Z01 and the left column to the model Z001. The upper row represents the gas species, the lower row the ice species, and the bottom row the total abundances. With decreasing metallicity the cavity in the midplane for all gas-phase species shown here shrinks (Z01) and vanishes (Z001). In the case of CH4, a second cavity in the upper layers of the disk grows as metallicity decreases.
Current usage metrics show cumulative count of Article Views (full-text article views including HTML views, PDF and ePub downloads, according to the available data) and Abstracts Views on Vision4Press platform.
Data correspond to usage on the plateform after 2015. The current usage metrics is available 48-96 hours after online publication and is updated daily on week days.
Initial download of the metrics may take a while.