Fig. 4
Download original image
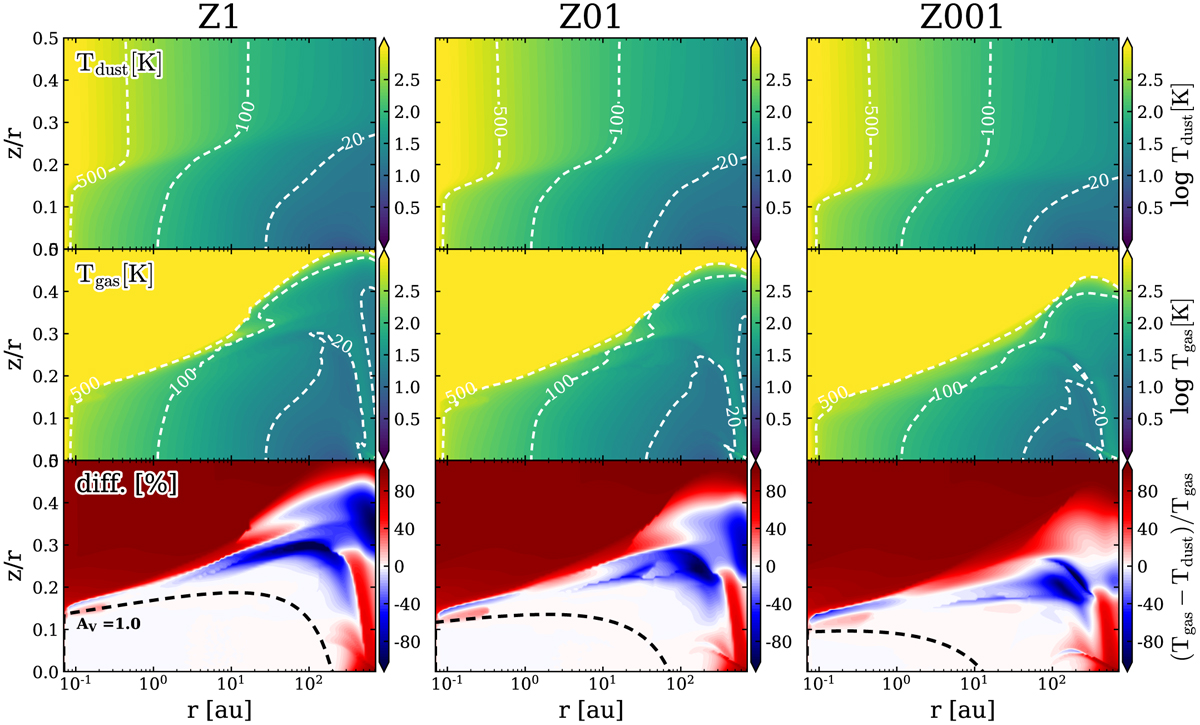
Contour plots of the models with different metallicities. The left, middle and right columns of the plot represent the models Z1, Z01, and Z001; the latter two exhibit 1/10 and 1/100 of the reference metallicity, respectively. The top, middle, and bottom rows correspond to the dust temperature, gas temperature, and the difference between the gas and dust temperature relative to the gas temperature. The decreasing metallicity leads to an increase in both dust and gas temperature but with the gas temperature increasing stronger (bottom row). The black dashed line represents the surface corresponding to a visual extinction of Av = 1.
Current usage metrics show cumulative count of Article Views (full-text article views including HTML views, PDF and ePub downloads, according to the available data) and Abstracts Views on Vision4Press platform.
Data correspond to usage on the plateform after 2015. The current usage metrics is available 48-96 hours after online publication and is updated daily on week days.
Initial download of the metrics may take a while.