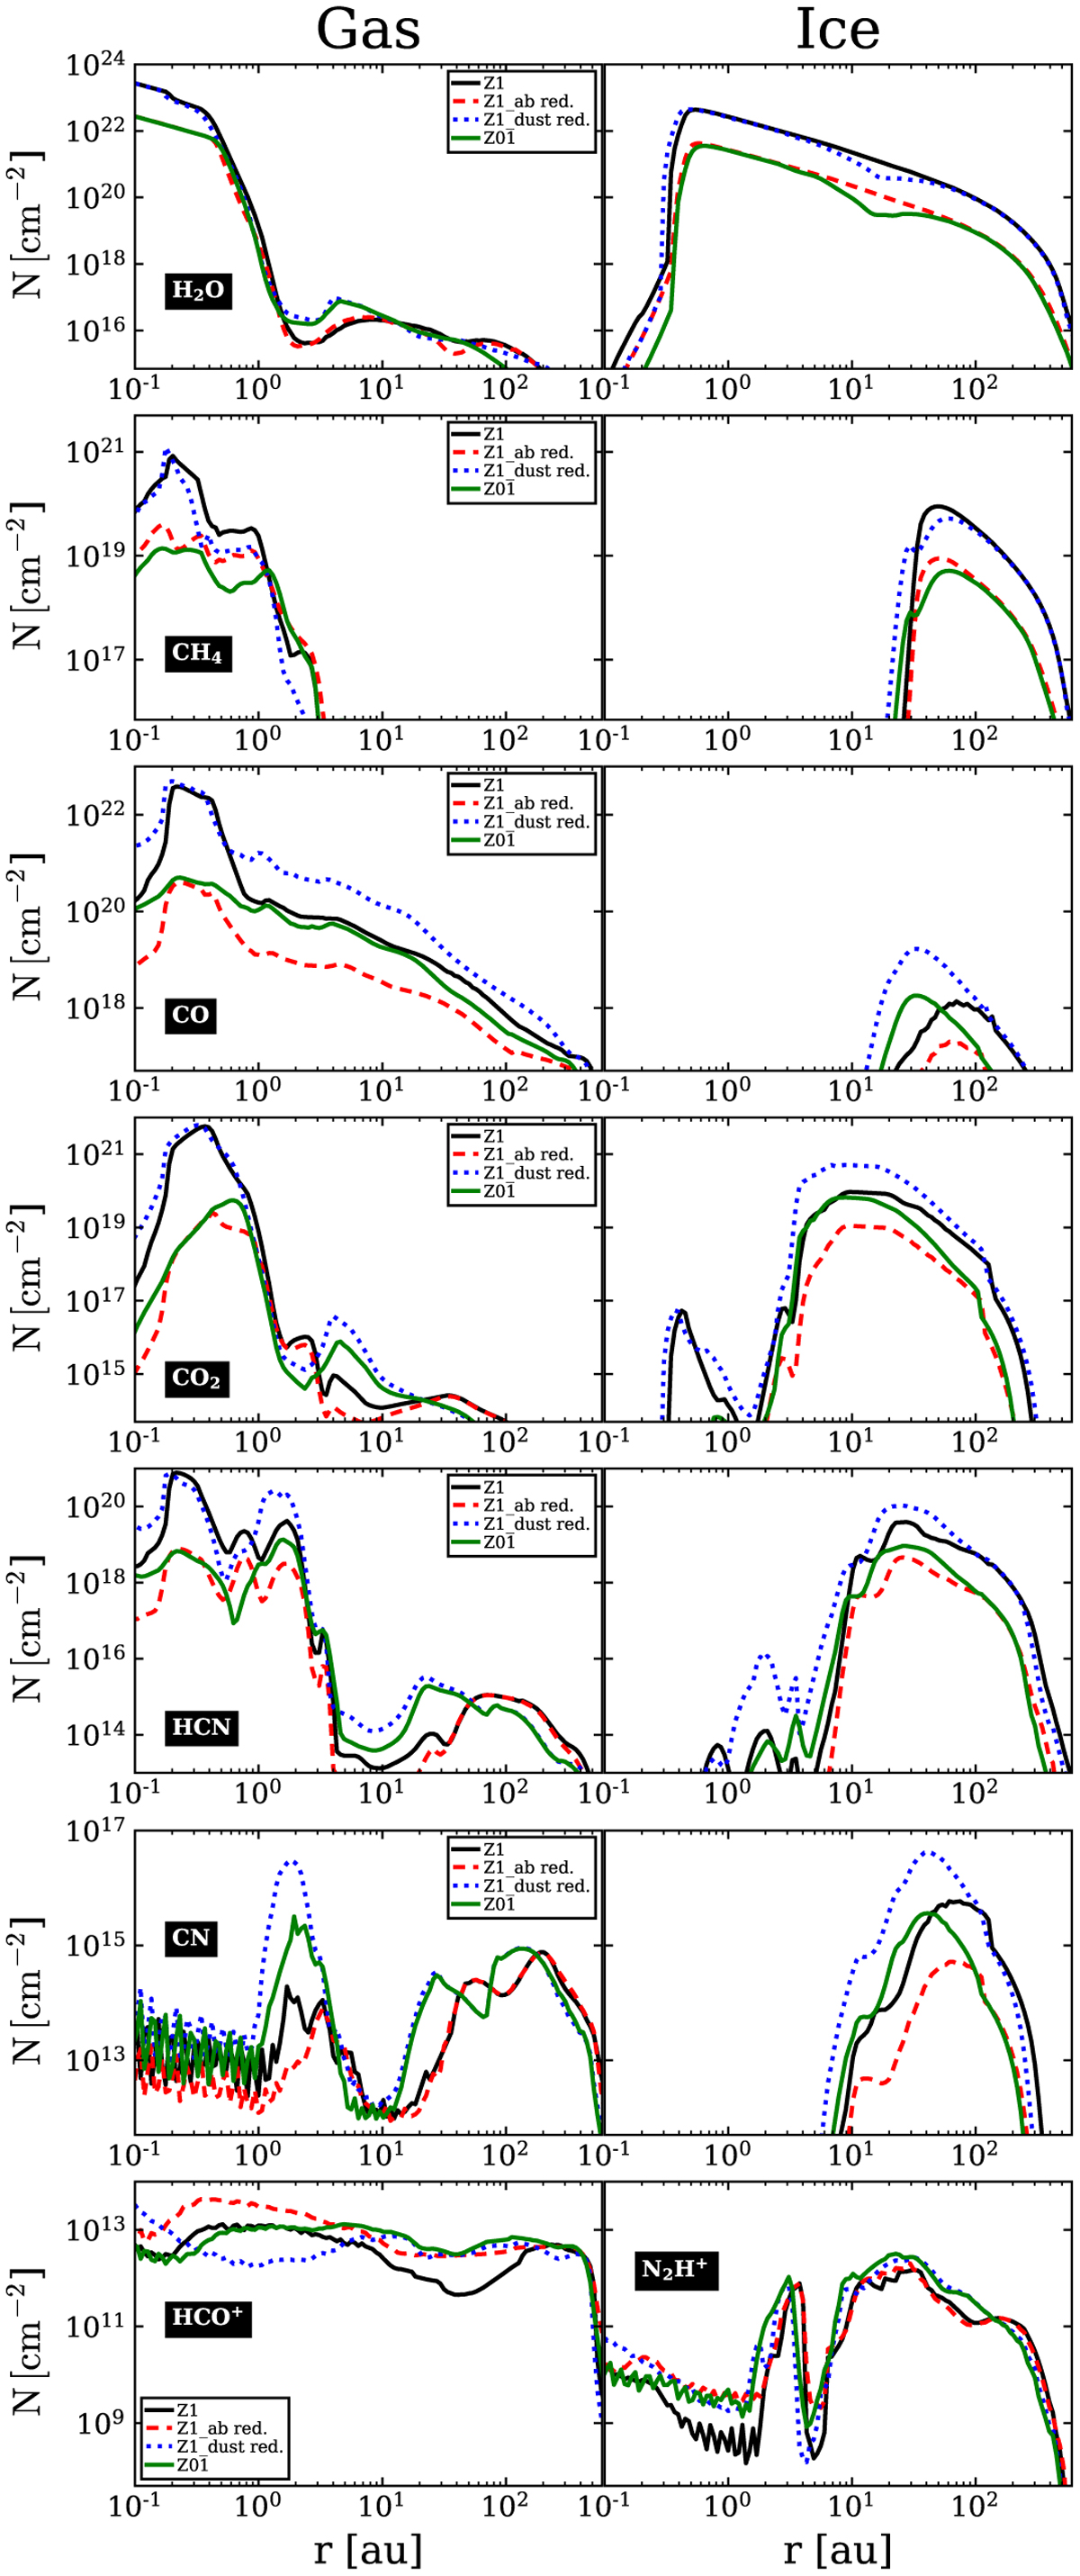
Fig. B.1
Download original image
Vertical column density of chemical species. With the exception of the bottom row, the left column shows the gaseous species and the left column the frozen species. the last row shows the ions HCO+ (left) and N2H+ (right). The reference model Z1 (solid black line), the model with only an elemental abundance reduction (dashed red line), the model with only dust-to-gas reduction (dotted blue line), and the Z01 (solid green line) show the effect of the two modifications done in this study separately.
Current usage metrics show cumulative count of Article Views (full-text article views including HTML views, PDF and ePub downloads, according to the available data) and Abstracts Views on Vision4Press platform.
Data correspond to usage on the plateform after 2015. The current usage metrics is available 48-96 hours after online publication and is updated daily on week days.
Initial download of the metrics may take a while.