Fig. 14
Download original image
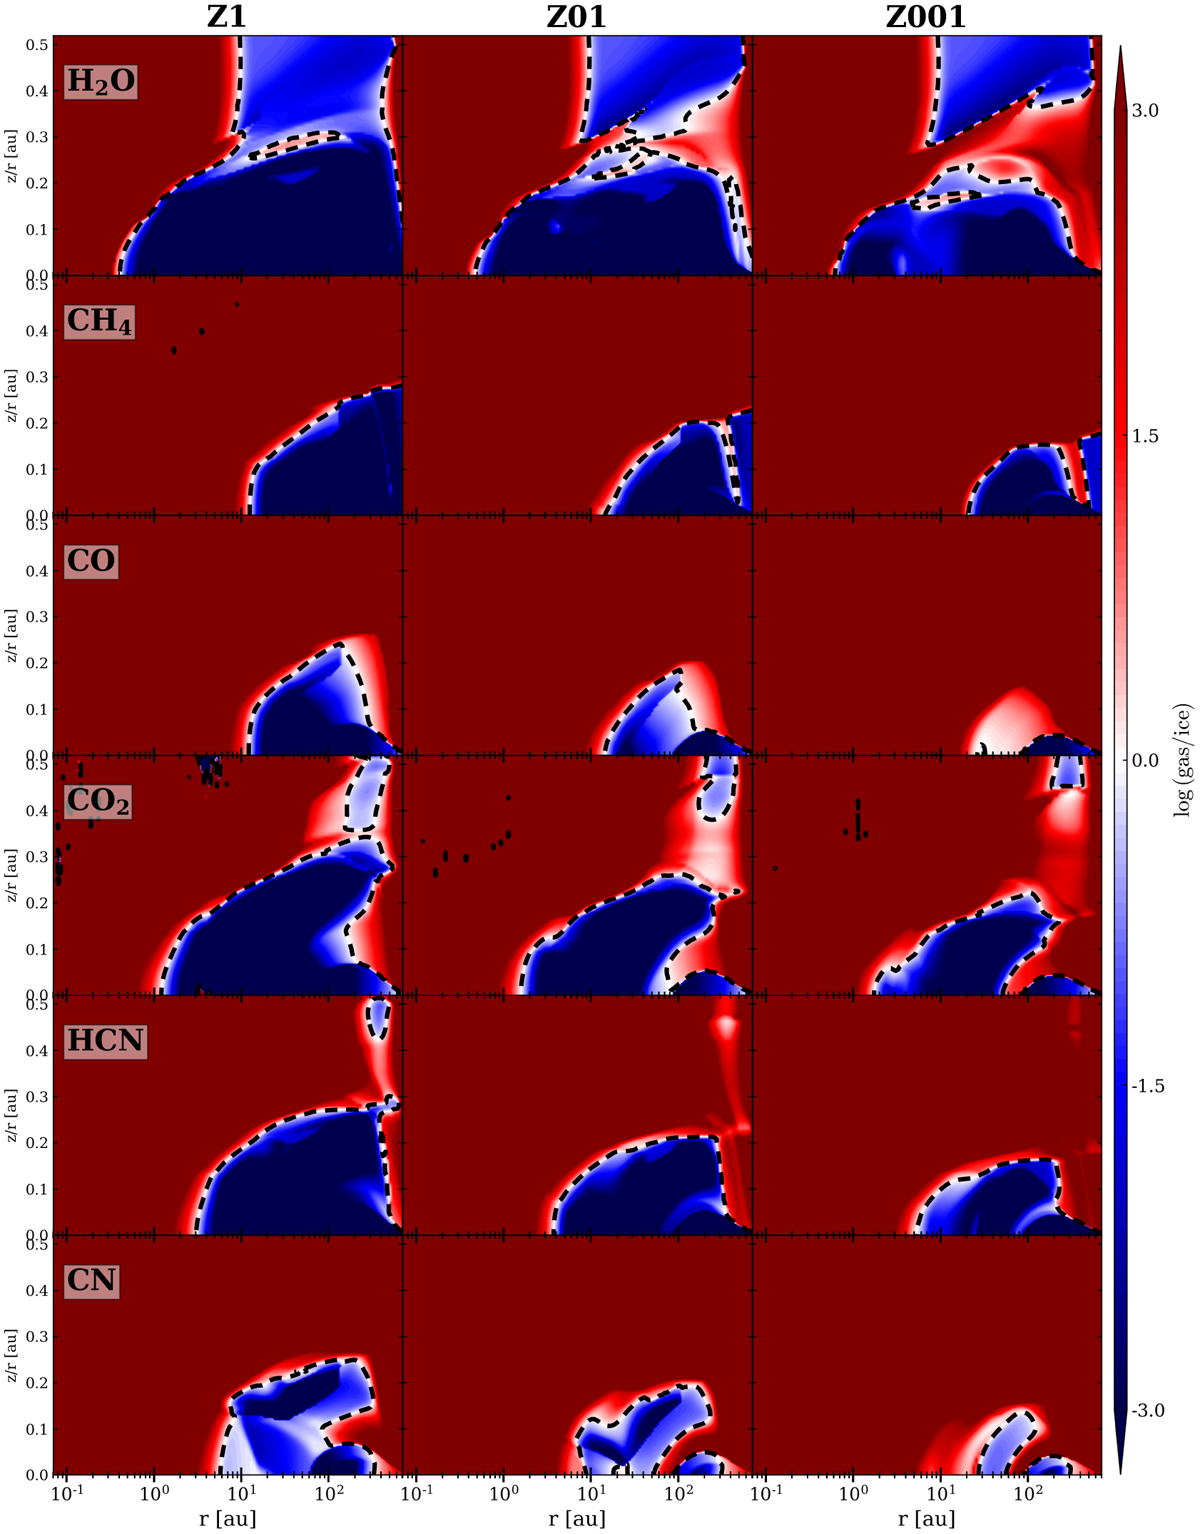
Gas-to-ice ratio of the molecules. The left, middle, and right columns represent the Z1, Z01, and Z001 models, respectively. Red and blue regions represent the regions where gas and ice are dominant respectively. The black dashed line shows where the ice and gas abundances are equal (snowline). The locations of the snowlines at the midplane are summarized in Fig. 15.
Current usage metrics show cumulative count of Article Views (full-text article views including HTML views, PDF and ePub downloads, according to the available data) and Abstracts Views on Vision4Press platform.
Data correspond to usage on the plateform after 2015. The current usage metrics is available 48-96 hours after online publication and is updated daily on week days.
Initial download of the metrics may take a while.