Fig. 13
Download original image
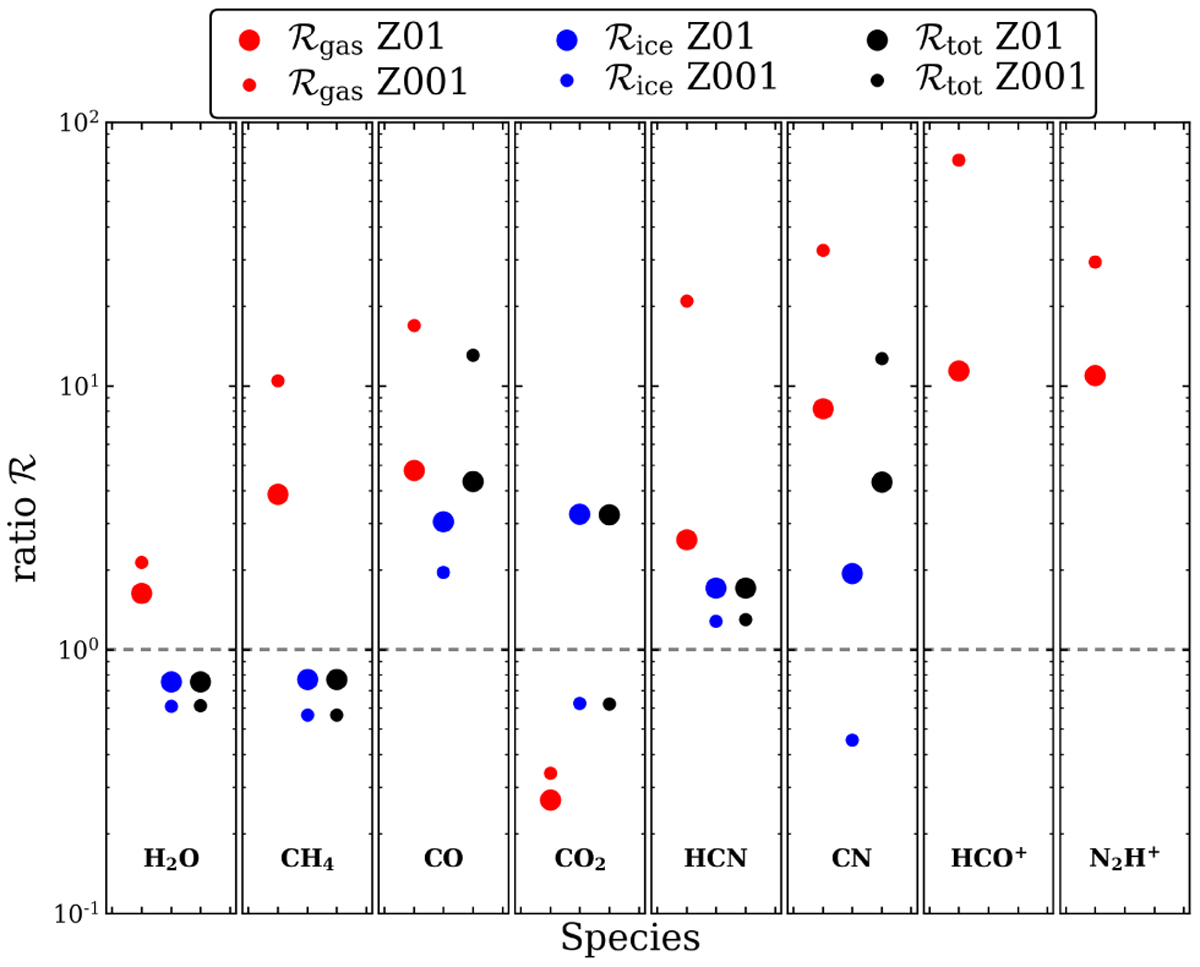
Ratio, R, (see Eq. (7)) of the total molecular amount of the scaled-down Z1 and the low metallicity models Z01 and Z001 for each species. The red, blue, and black circles correspond to the ratios of the gaseous, ice, and total (gas + ice) species, respectively. The dashed horizontal line shows the value for the ratio equal to 1.
Current usage metrics show cumulative count of Article Views (full-text article views including HTML views, PDF and ePub downloads, according to the available data) and Abstracts Views on Vision4Press platform.
Data correspond to usage on the plateform after 2015. The current usage metrics is available 48-96 hours after online publication and is updated daily on week days.
Initial download of the metrics may take a while.