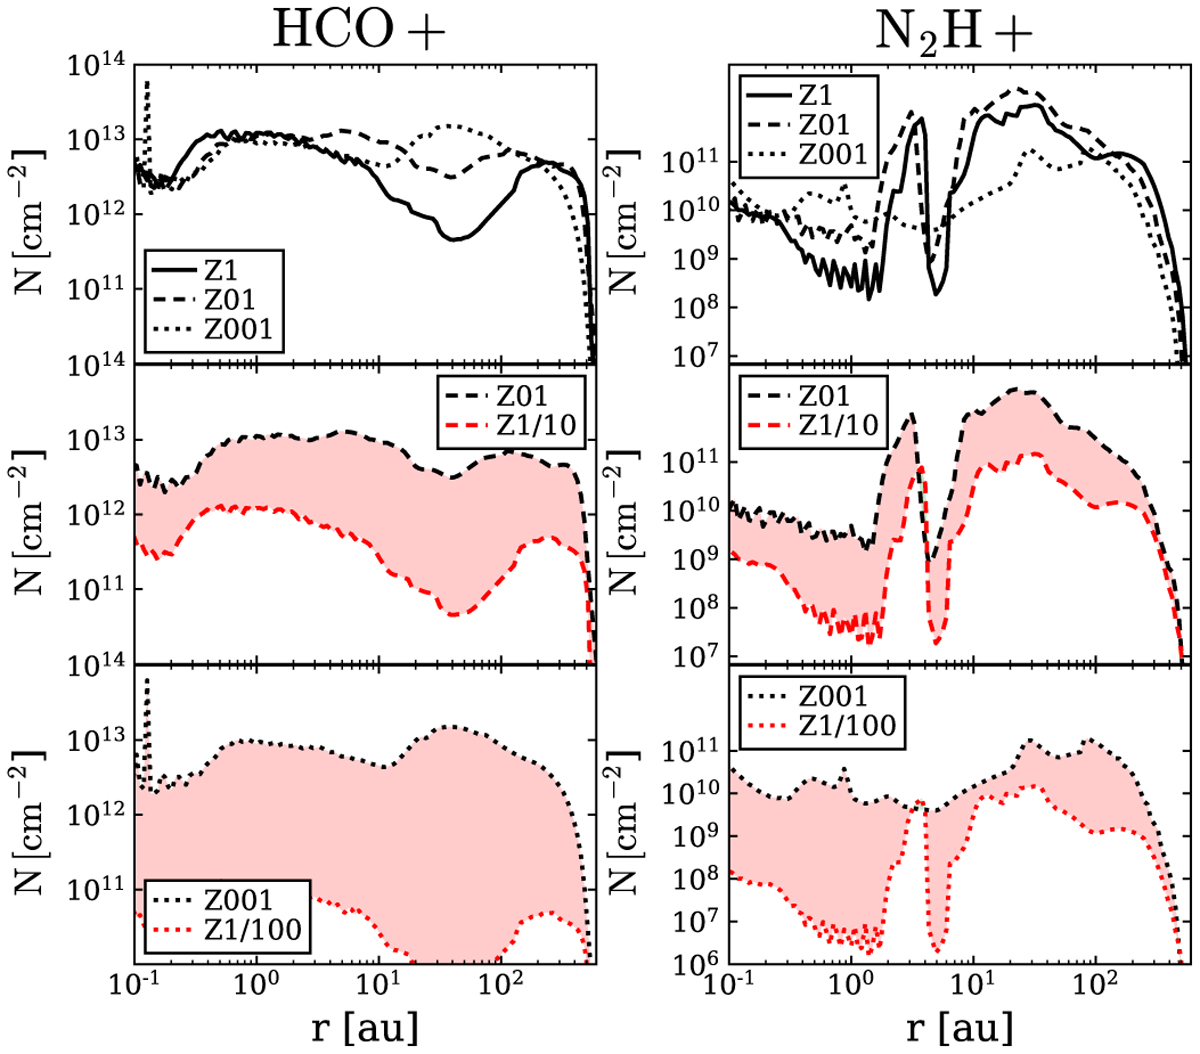
Fig. 12
Download original image
Total vertical column density of HCO+ and N2H+ for the models. Top row shows models Z1, Z01, and Z001 (solid, dashed, and dotted lines, respectively). The middle row shows the difference between the Z01 model (black dashed line) and the values by reducing the vertical column density of Z1 manually by a factor of 10 (red dashed line). The red show the cases where the vertical column density is higher than the simple scaled-down values. The bottom row shows the same plots as the middle row but for the Z001 model and the Z1 model reduced by a factor of 100.
Current usage metrics show cumulative count of Article Views (full-text article views including HTML views, PDF and ePub downloads, according to the available data) and Abstracts Views on Vision4Press platform.
Data correspond to usage on the plateform after 2015. The current usage metrics is available 48-96 hours after online publication and is updated daily on week days.
Initial download of the metrics may take a while.