Open Access
Fig. A.3.
Download original image
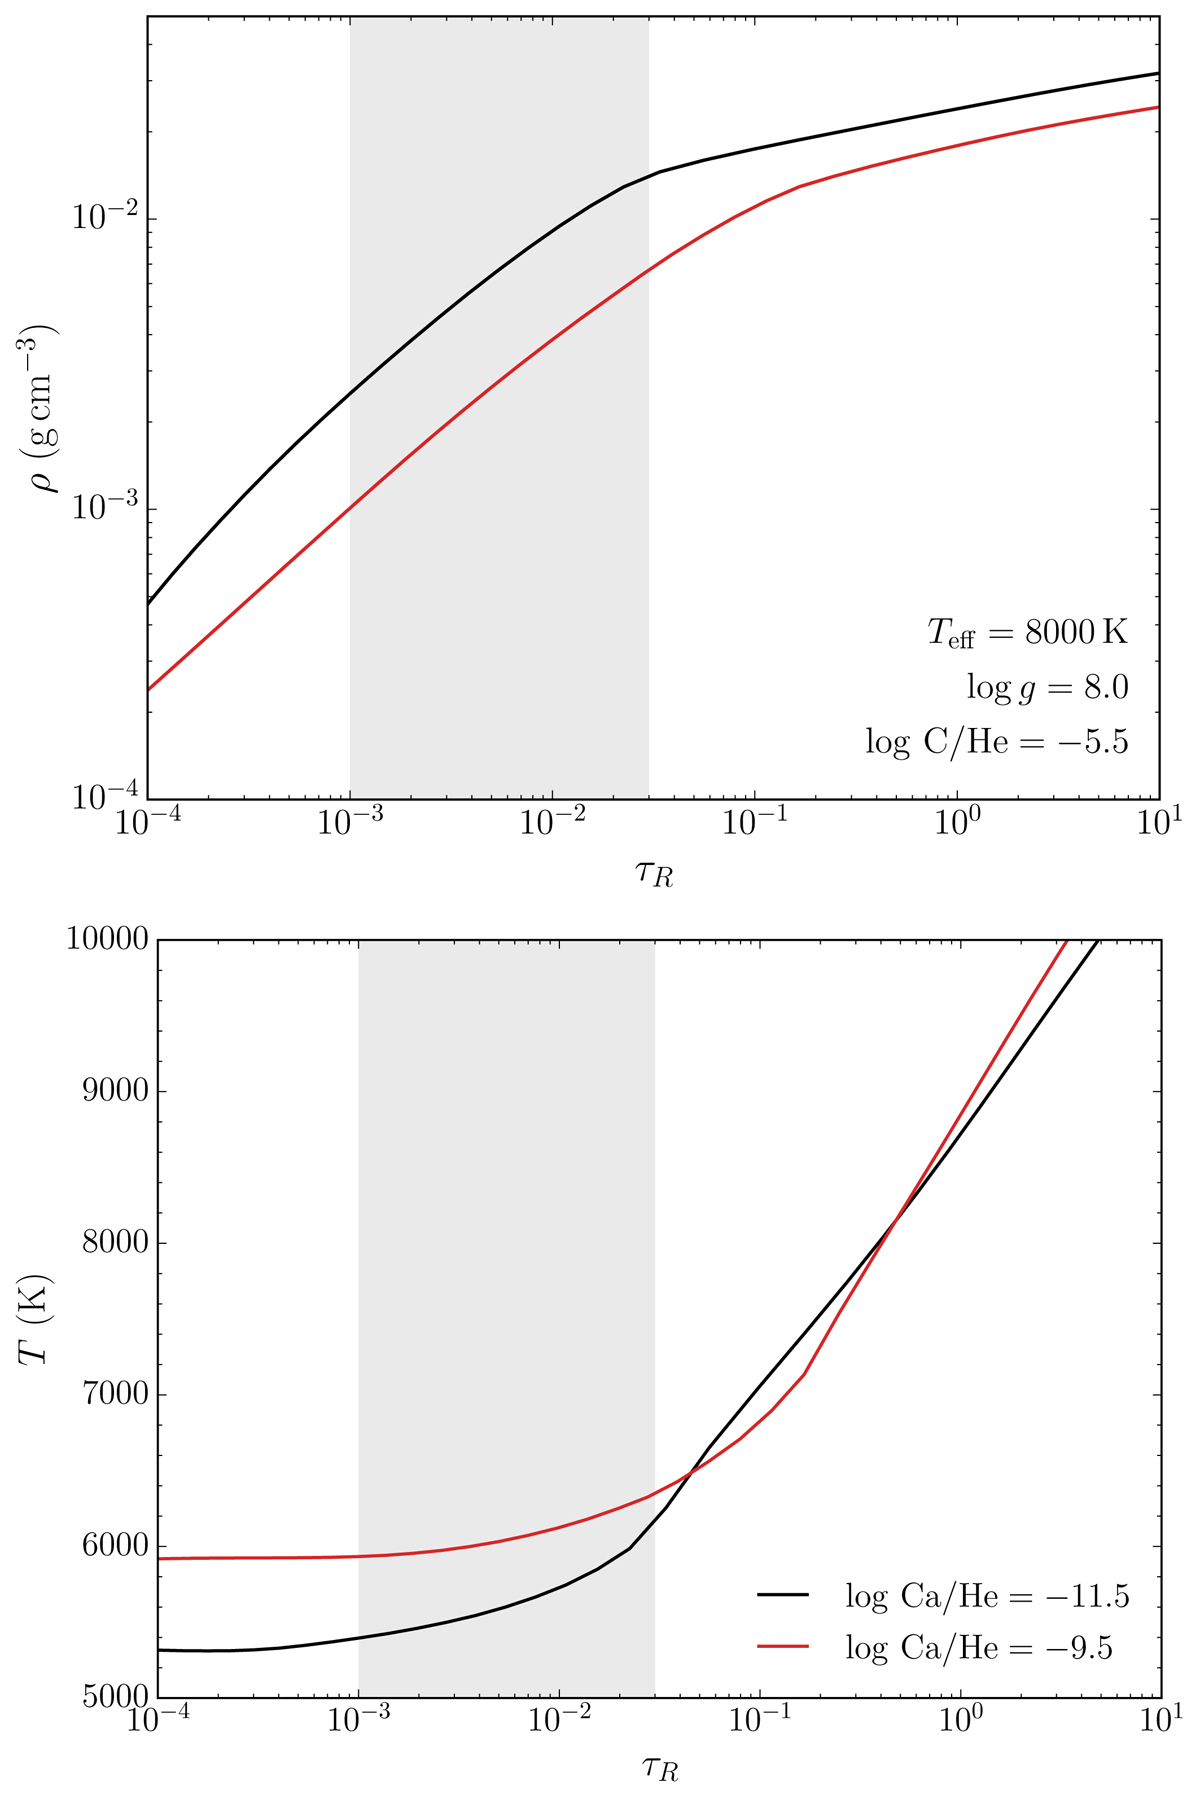
Mass density (top panel) and temperature (bottom panel) as a function of the Rosseland mean optical depth for DQZ white dwarfs with Teff = 8000 K, log g = 8, log C/He = −5.5, and different Ca/He values (black lines correspond to log Ca/He = −11.5 and red lines to log Ca/He = −9.5).
Current usage metrics show cumulative count of Article Views (full-text article views including HTML views, PDF and ePub downloads, according to the available data) and Abstracts Views on Vision4Press platform.
Data correspond to usage on the plateform after 2015. The current usage metrics is available 48-96 hours after online publication and is updated daily on week days.
Initial download of the metrics may take a while.