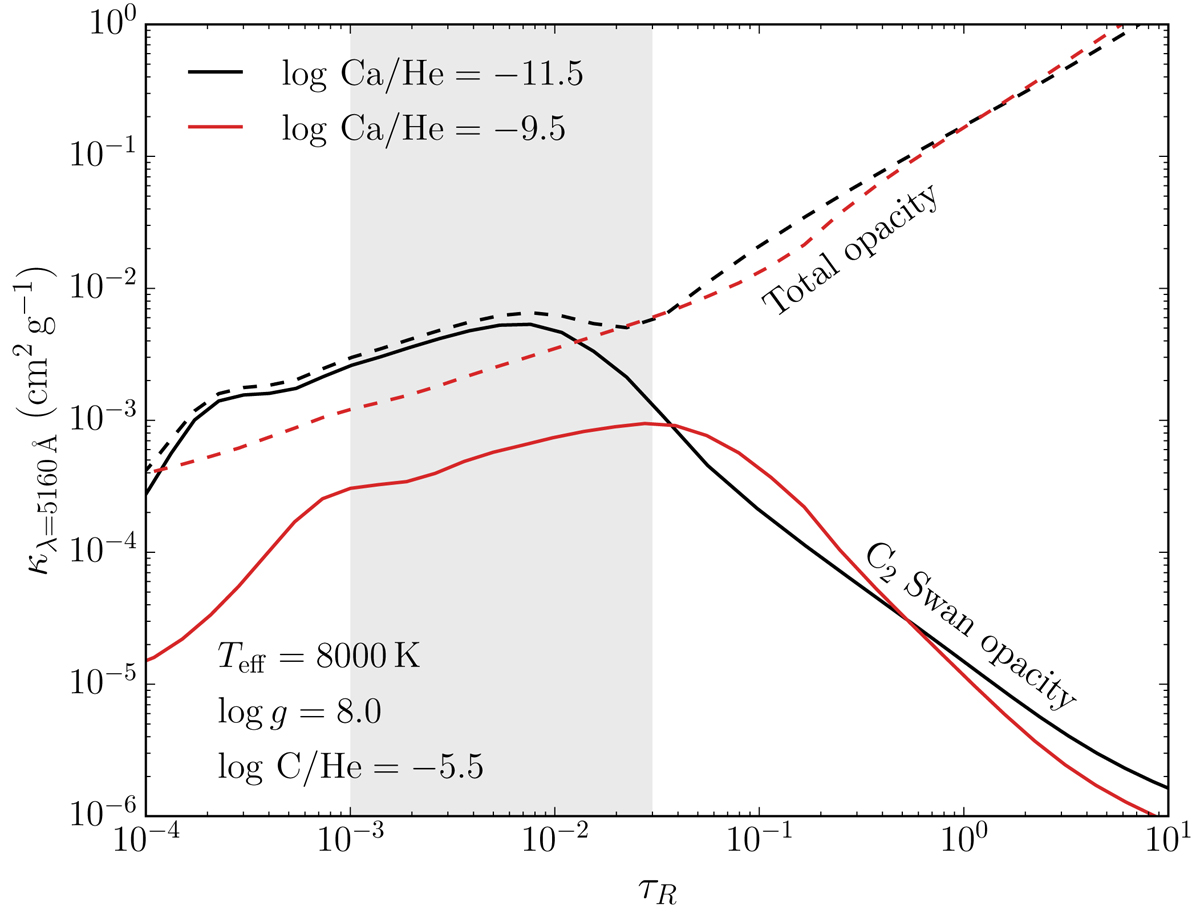
Fig. 4.
Download original image
Opacity at 5160 Å as a function of the Rosseland optical depth for DQZ white dwarfs with Teff = 8000 K, log g = 8, log C/He = −5.5, and different Ca/He values (black lines correspond to log Ca/He = −11.5 and red lines to log Ca/He = −9.5). The dashed lines show the total opacity, while the solid lines show the opacity due to the Swan bands only. The wavelength chosen for this figure (5160 Å) corresponds to where the Swan bands are strongest. The grey region indicates where the Swan bands are formed.
Current usage metrics show cumulative count of Article Views (full-text article views including HTML views, PDF and ePub downloads, according to the available data) and Abstracts Views on Vision4Press platform.
Data correspond to usage on the plateform after 2015. The current usage metrics is available 48-96 hours after online publication and is updated daily on week days.
Initial download of the metrics may take a while.