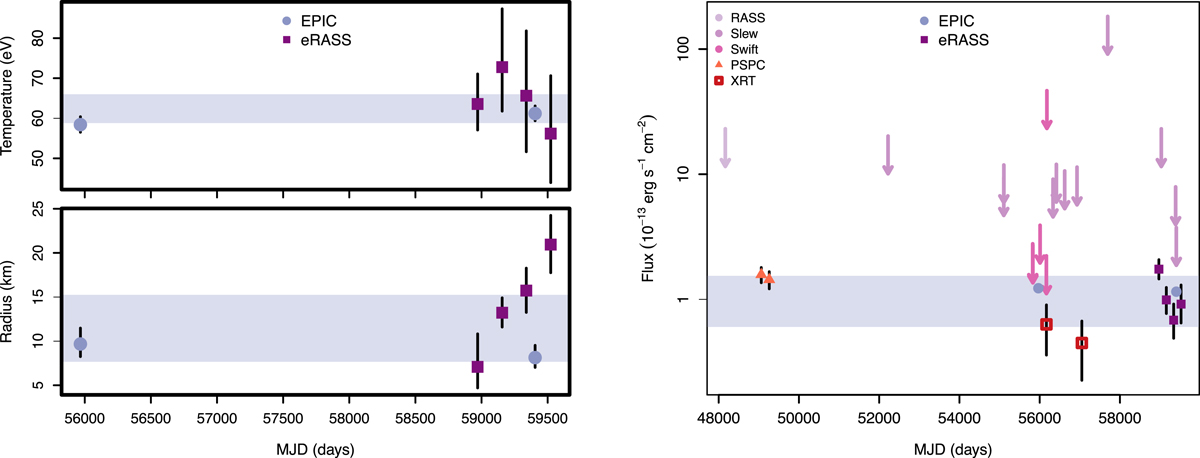
Fig. 4.
Download original image
Long-term spectral and flux variation of the X-ray source. Left panel: blackbody temperature and emission radius as a function of MJD (“variable” model 4; see Tables 4–5). Right panel: long-term evolution of the 0.2 − 2 keV X-ray flux of the target, including upper limits and previous detection by other X-ray missions. The time interval extends back to the ROSAT All-Sky Survey (RASS) and pointed (PSPC) era and include data points from Swift XRT and XMM-Newton slew observations (see the text, for details). In all plots the purple horizontal shaded areas show the 1σ median absolute deviation of the parameters.
Current usage metrics show cumulative count of Article Views (full-text article views including HTML views, PDF and ePub downloads, according to the available data) and Abstracts Views on Vision4Press platform.
Data correspond to usage on the plateform after 2015. The current usage metrics is available 48-96 hours after online publication and is updated daily on week days.
Initial download of the metrics may take a while.