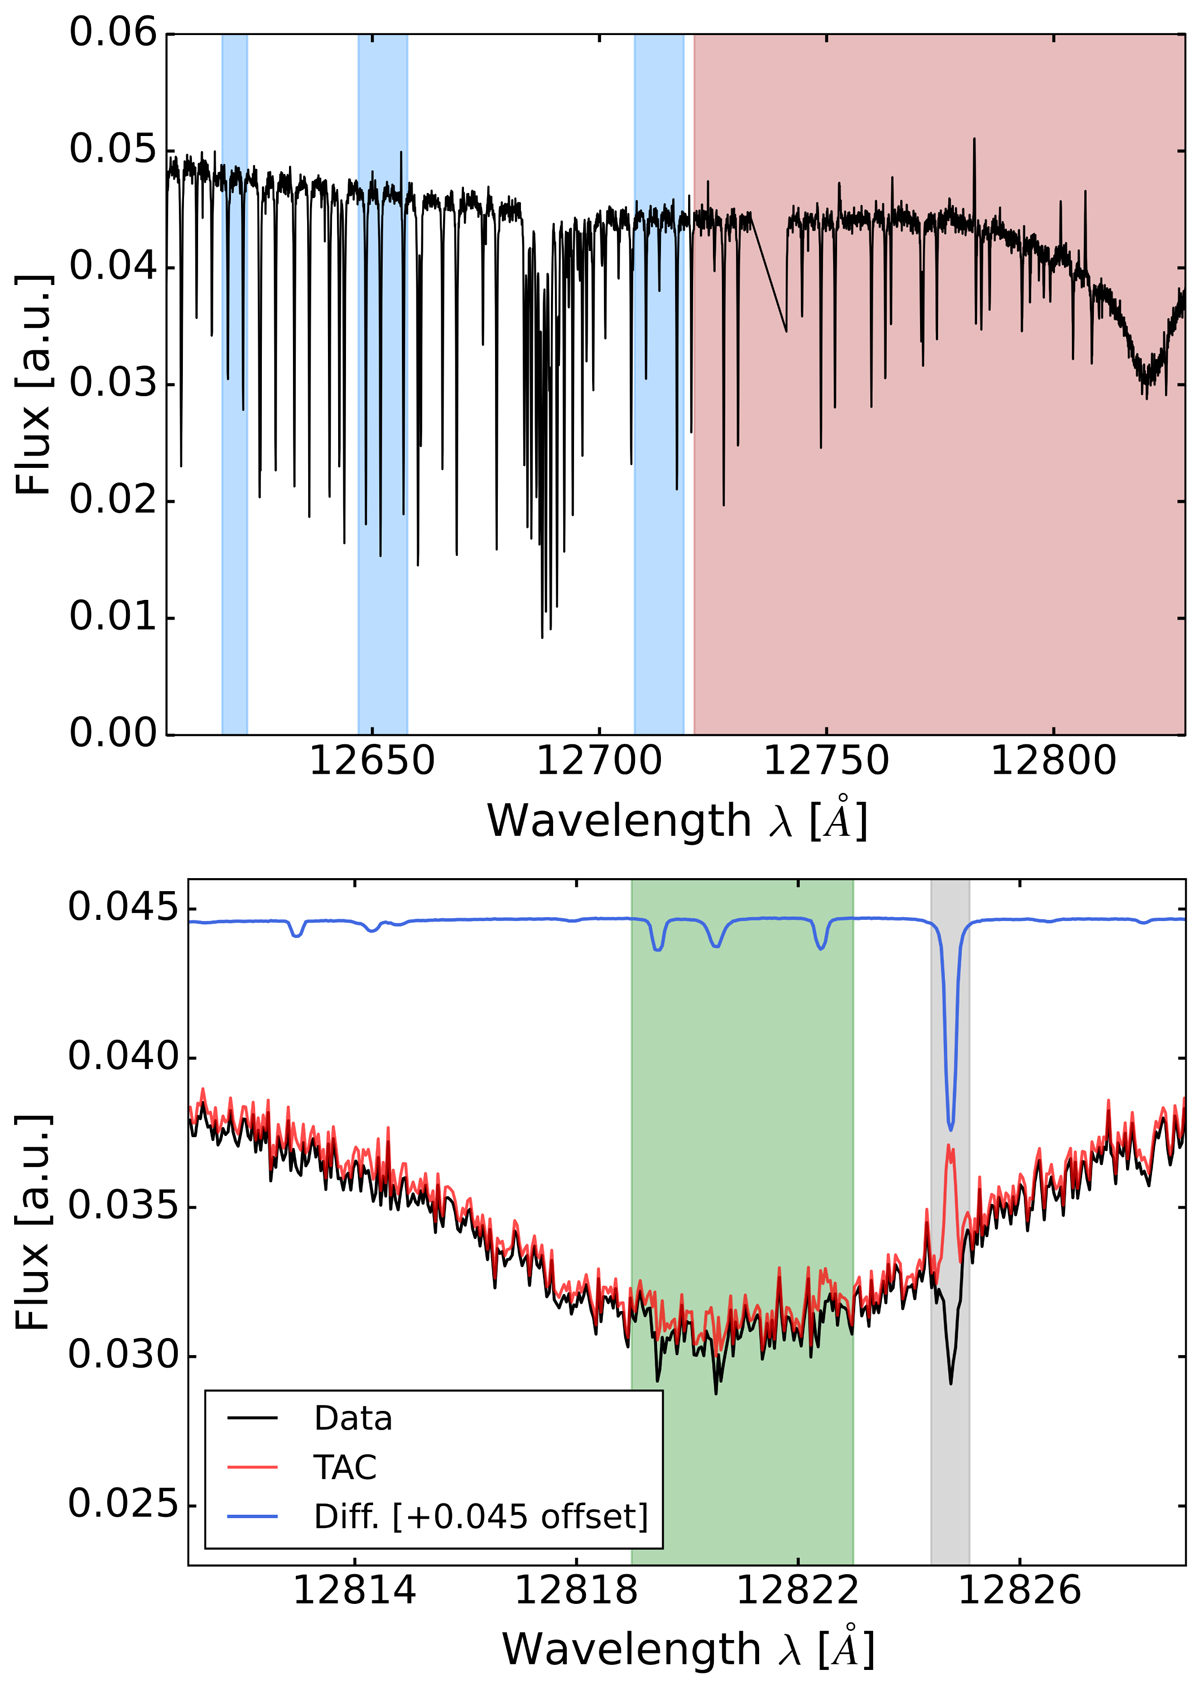
Fig. A.1.
Download original image
Setup and results of the telluric correction with molecfit. Upper panel: Flux observed as a function of wavelength at an orbital phase of −0.001. The regions included in the molecfit analyses contain telluric lines of different depths (with no saturation) and are shaded in blue (spectral regions from 12617.01 to 12622.54 Å, from 12646.96 to 12657.79 Å, and from 12707.77 to 12718.60 Å). The 12720.90−12844.15 Å region shaded in red contains the stellar Paβ absorption and was excluded from all molecfit fits. Bottom panel: Zoomed-in view of the stellar Paβ line. The observed flux from the upper panel is shown in black, the telluric-corrected spectrum (TAC) is shown in red, and the difference between both is shown in blue (with an offset for clarity). The telluric contribution in the spectral region containing the exoplanet Paβ signal (shaded in green) is very small, with negligible residuals after the fit. The spectral region from 12824.4 Å to 12825.1 Å (shaded in gray), containing a poorly fitted telluric line, was masked for the entire analysis.
Current usage metrics show cumulative count of Article Views (full-text article views including HTML views, PDF and ePub downloads, according to the available data) and Abstracts Views on Vision4Press platform.
Data correspond to usage on the plateform after 2015. The current usage metrics is available 48-96 hours after online publication and is updated daily on week days.
Initial download of the metrics may take a while.