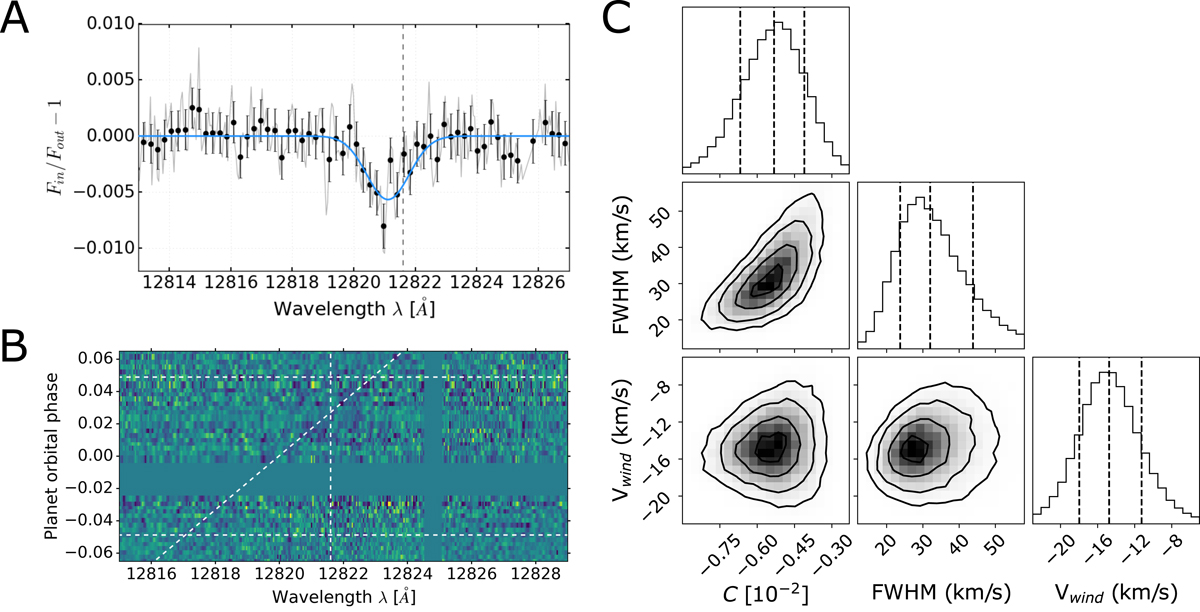
Fig. 2.
Download original image
Panel A: transmission spectrum of KELT-9 b around the Paβ wavelengths in the rest frame of the exoplanet. The unbinned spectrum is shown in light gray, and the binned spectrum is shown in black, with error bars computed by propagating the instrumental error. The blue curve is the Gaussian best fit to the absorption line we retrieved. The vertical line marks the vacuum wavelength of Paβ. Panel B: residual spectral matrix in the rest frame of the Earth obtained after correcting the telluric contribution and dividing out the master out-of-transit spectrum. The horizontal lines mark the starting and ending orbital phases of the planetary transit, the vertical line marks the vacuum wavelength of the Paβ transition, and the tilted line marks the expected trail of potential absorption signals of the exoplanet (combination of orbital planet velocities with respect to the Earth and systemic and barycentric velocities). Noisy pixel columns were masked and excluded from the analyses. No spectra were observed between orbital phases −0.026 and −0.001. Panel C: probability distributions resulting from the multidimensional analysis of the observed line.
Current usage metrics show cumulative count of Article Views (full-text article views including HTML views, PDF and ePub downloads, according to the available data) and Abstracts Views on Vision4Press platform.
Data correspond to usage on the plateform after 2015. The current usage metrics is available 48-96 hours after online publication and is updated daily on week days.
Initial download of the metrics may take a while.