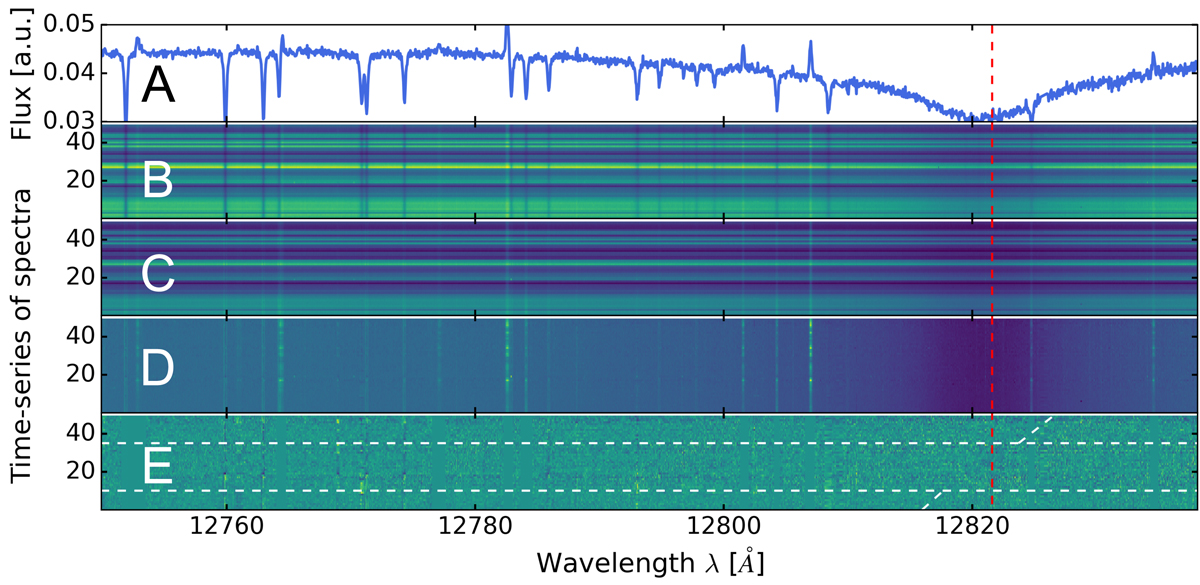
Fig. 1.
Download original image
Observed flux and spectral matrices through the different analysis steps performed in the rest frame of the Earth. Panel A shows the observed stellar flux around mid-transit as a function of wavelength, and panel B shows the original spectral matrix observed (flux as a function of wavelength and time). A telluric-corrected version of this matrix is shown in panel C. The normalized and telluric-corrected matrix is depicted in panel D, and the residual spectral matrix obtained after removing the stellar contribution and masking noisy columns is shown in panel E. The horizontal lines mark the beginning and end of the planet’s transit. The tilted lines mark the expected trail of a potential Paβ signal from the planet. The vertical line spanning all panels marks the vacuum wavelength of the Paβ transition. A zoomed-in version of panel E around the expected trail of the planet’s Paβ line is shown in Fig. 2B.
Current usage metrics show cumulative count of Article Views (full-text article views including HTML views, PDF and ePub downloads, according to the available data) and Abstracts Views on Vision4Press platform.
Data correspond to usage on the plateform after 2015. The current usage metrics is available 48-96 hours after online publication and is updated daily on week days.
Initial download of the metrics may take a while.