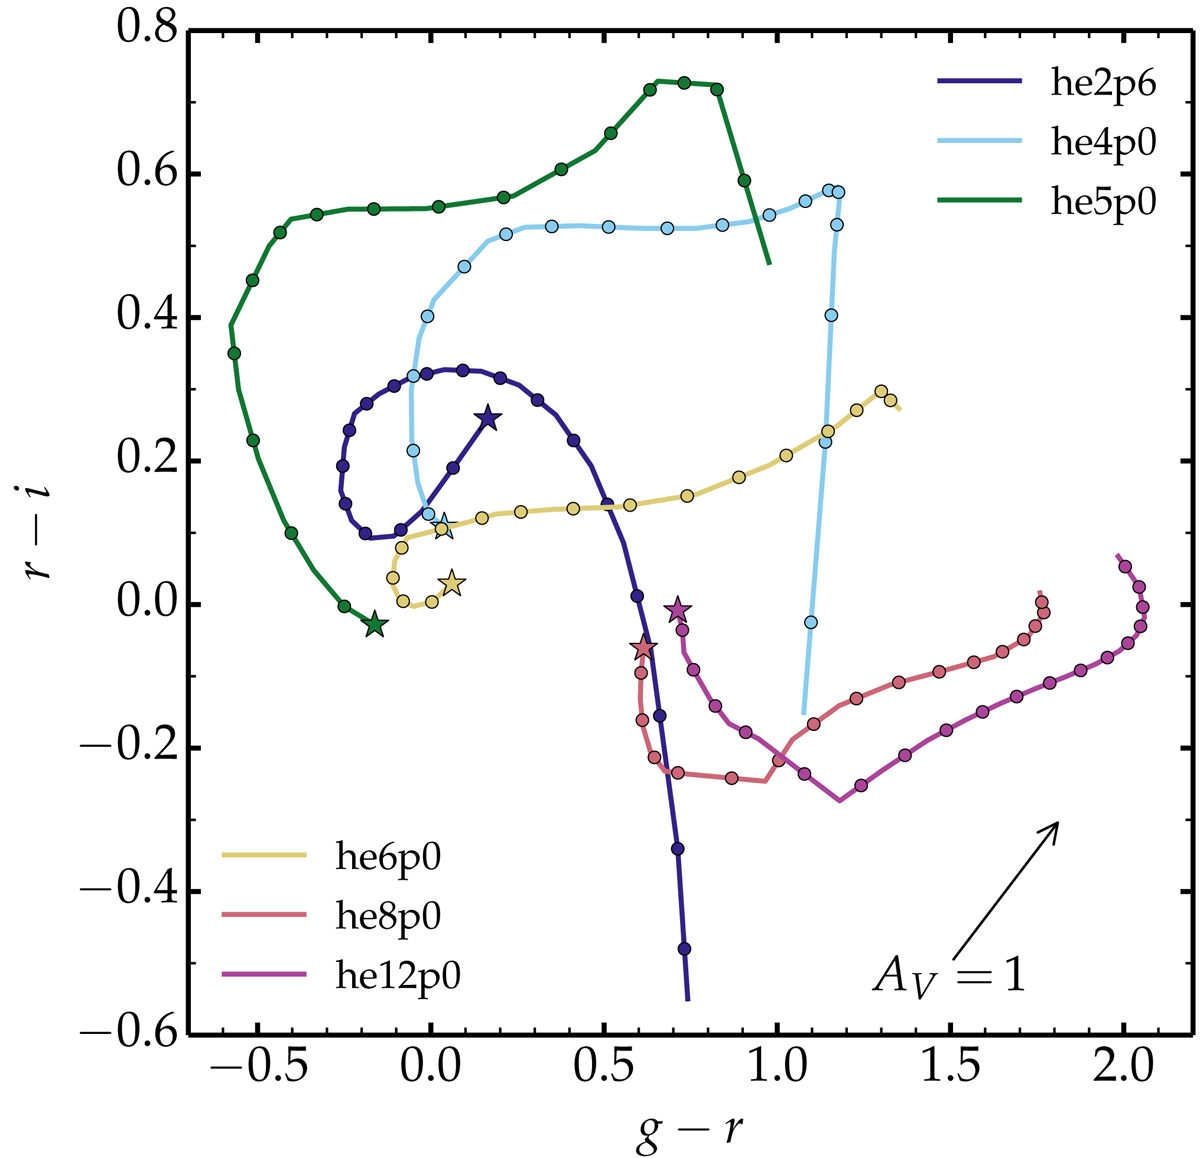
Fig. 3.
Download original image
LSST color-color magnitude diagram for the Type Ibc simulations of Dessart et al. (in prep.) from 100 to about 450 d after explosion. We show the color curves r − i vs. g − r for our He-star explosion models from 100 d (indicated by a star symbol) until the end of the simulation at around 450 d. Dots are equally spaced in time every 20 d. The arrow corresponds to the color shift caused by AV = 1 mag.
Current usage metrics show cumulative count of Article Views (full-text article views including HTML views, PDF and ePub downloads, according to the available data) and Abstracts Views on Vision4Press platform.
Data correspond to usage on the plateform after 2015. The current usage metrics is available 48-96 hours after online publication and is updated daily on week days.
Initial download of the metrics may take a while.