Open Access
Fig. 2.
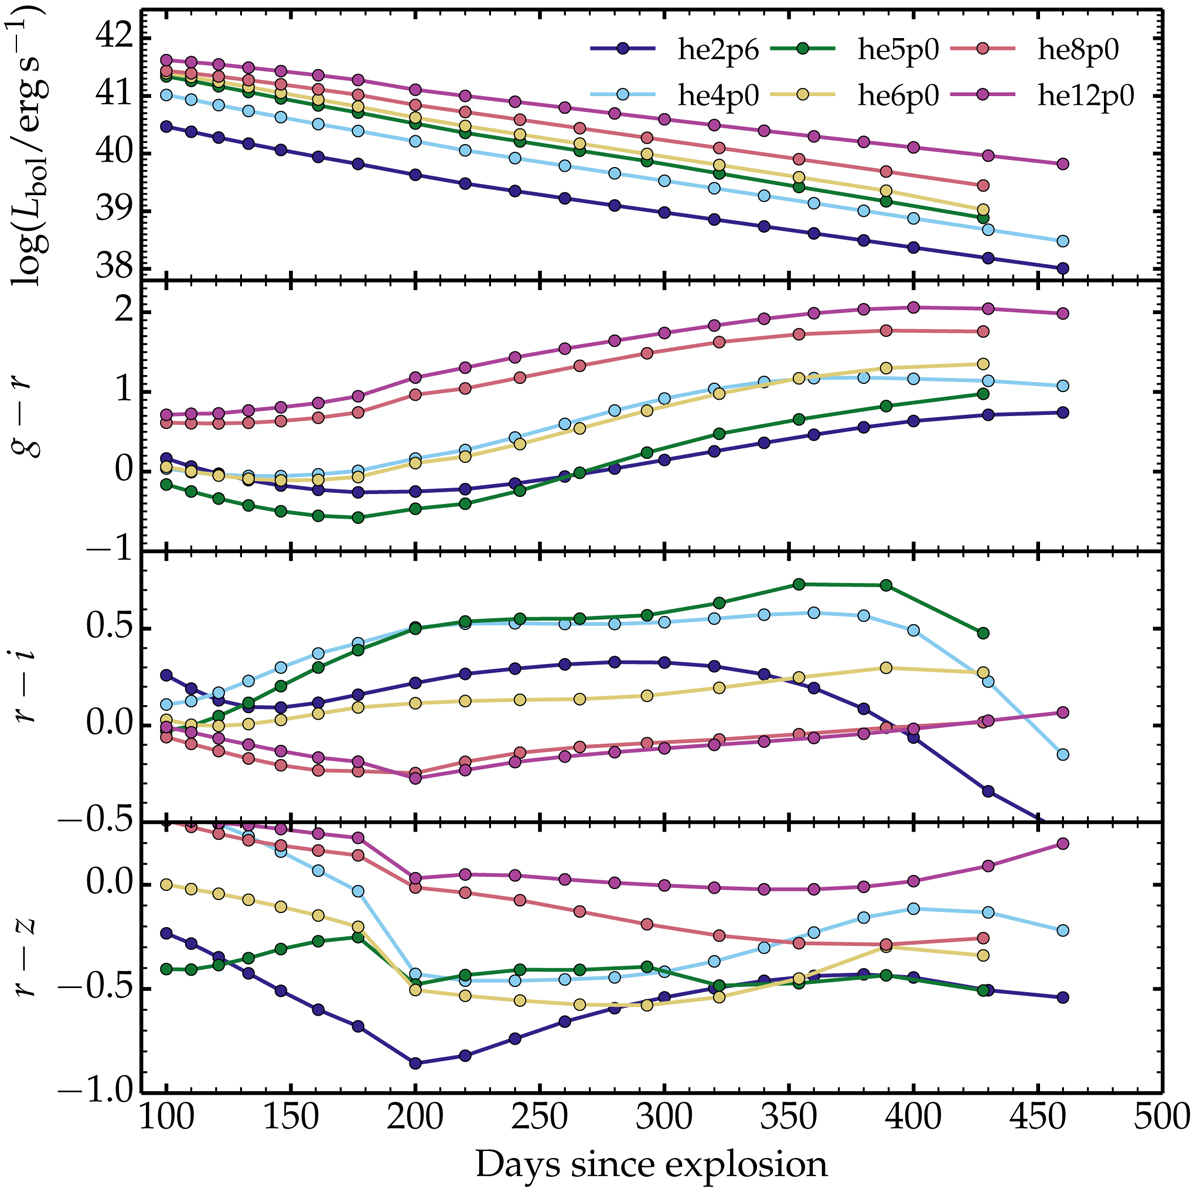
Download original image
Photometric properties of a sample of He-star explosion models from 100 to about 450 d after explosion. The bolometric light curve is shown at top, followed by the color curves g − r, r − i, and r − z. The original models are presented in D21, but their full time evolution is discussed in Dessart et al. (in prep.).
Current usage metrics show cumulative count of Article Views (full-text article views including HTML views, PDF and ePub downloads, according to the available data) and Abstracts Views on Vision4Press platform.
Data correspond to usage on the plateform after 2015. The current usage metrics is available 48-96 hours after online publication and is updated daily on week days.
Initial download of the metrics may take a while.