Fig. 1.
Download original image
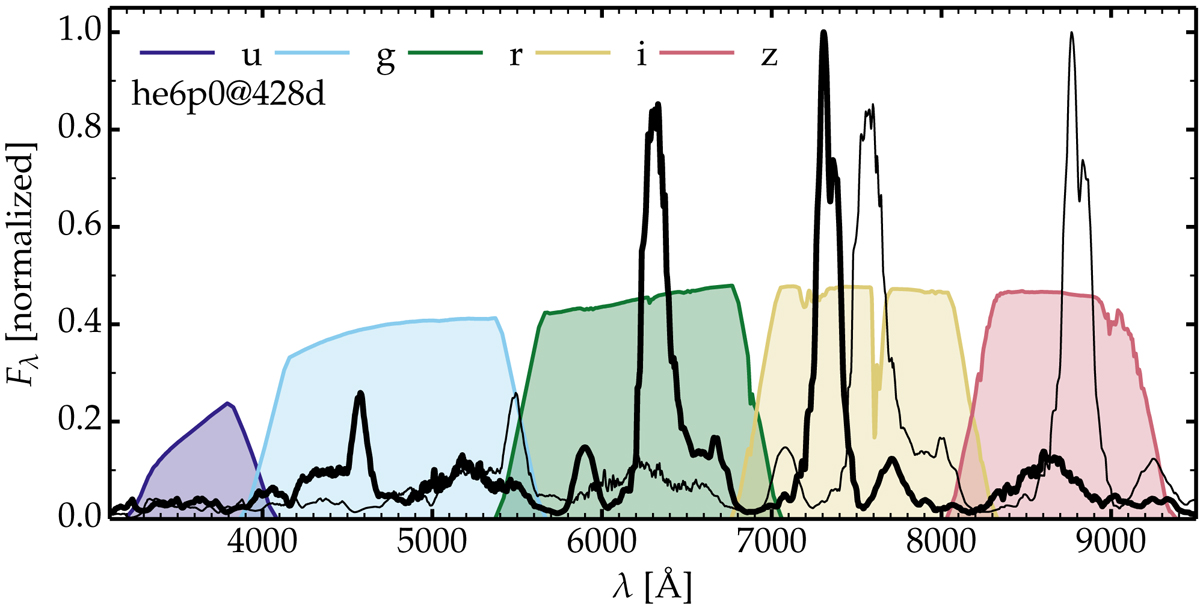
Spectrum for model he6p0 at 428 d after explosion (thick black line; Dessart et al., in prep.) together with the normalized LSST ugriz filter transmission functions (the y filter is not included in that figure). The thin black line is the model spectrum for a redshift of 0.2. For redshifts of ∼0.1 the photometric measures would be hard to use since [O I] λλ 6300, 6364, and [Ca II] λλ 7291, 7323 fall between filters.
Current usage metrics show cumulative count of Article Views (full-text article views including HTML views, PDF and ePub downloads, according to the available data) and Abstracts Views on Vision4Press platform.
Data correspond to usage on the plateform after 2015. The current usage metrics is available 48-96 hours after online publication and is updated daily on week days.
Initial download of the metrics may take a while.