Fig. 5.
Download original image
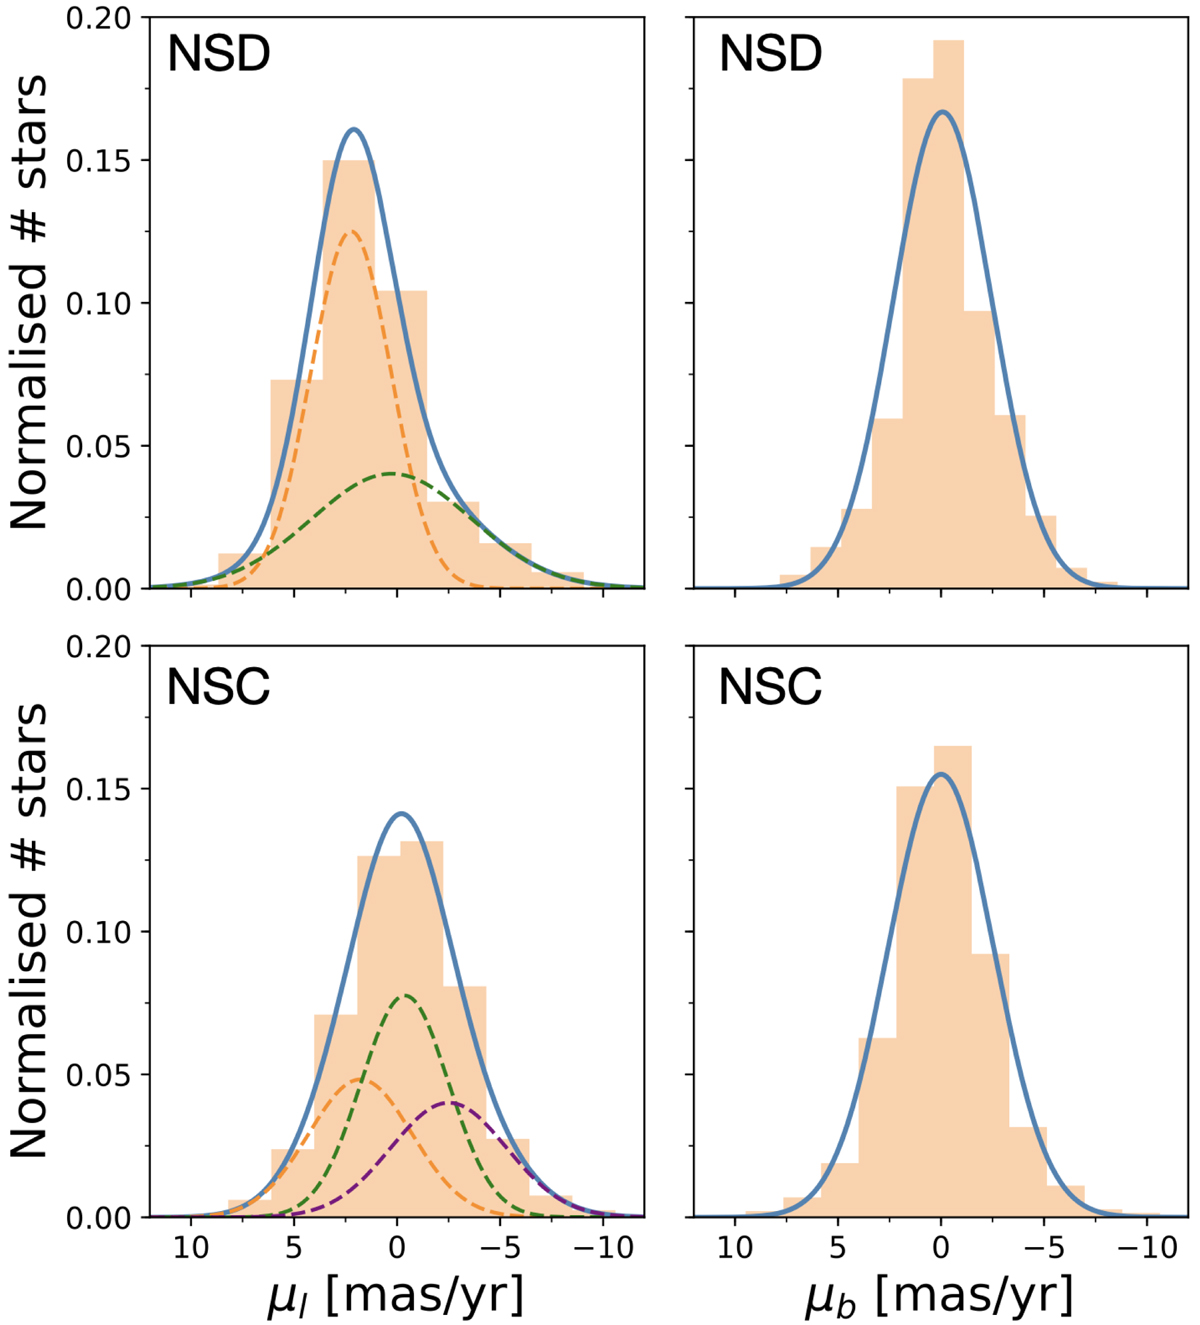
GMM analysis of the proper motion distributions. Upper panels: GMM modelling for the proper motion distribution (μl and μb, left and right panels, respectively) of the low-extinction group of stars that corresponds to the NSD. The blue lines show the total GMM model whereas the coloured dashed lines indicate each individual Gaussian contributing to the total model. Lower panels: similar to the upper panels but for the high-extinction group of stars corresponding to the NSC.
Current usage metrics show cumulative count of Article Views (full-text article views including HTML views, PDF and ePub downloads, according to the available data) and Abstracts Views on Vision4Press platform.
Data correspond to usage on the plateform after 2015. The current usage metrics is available 48-96 hours after online publication and is updated daily on week days.
Initial download of the metrics may take a while.