Fig. 2.
Download original image
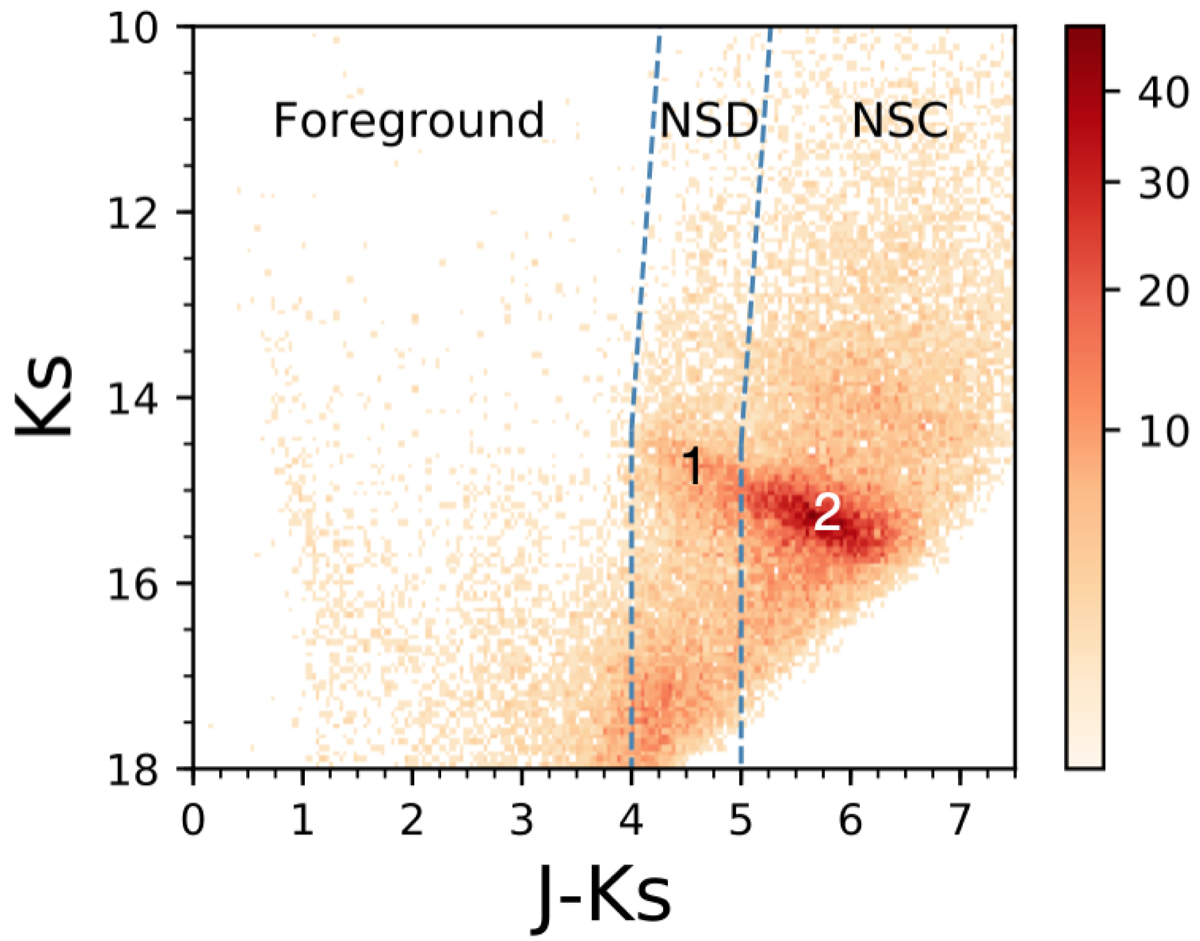
Colour–magnitude diagram Ks vs. J − Ks. The colour code corresponds to stellar densities using a power stretch scale, where the number of stars per bin is indicated with the colour bar. The blue dashed lines show the division between foreground, NSD, and NSC stars. The numbers 1 and 2 indicate the red clump bumps with different extinction that belong to the NSD, and the NSC, respectively.
Current usage metrics show cumulative count of Article Views (full-text article views including HTML views, PDF and ePub downloads, according to the available data) and Abstracts Views on Vision4Press platform.
Data correspond to usage on the plateform after 2015. The current usage metrics is available 48-96 hours after online publication and is updated daily on week days.
Initial download of the metrics may take a while.