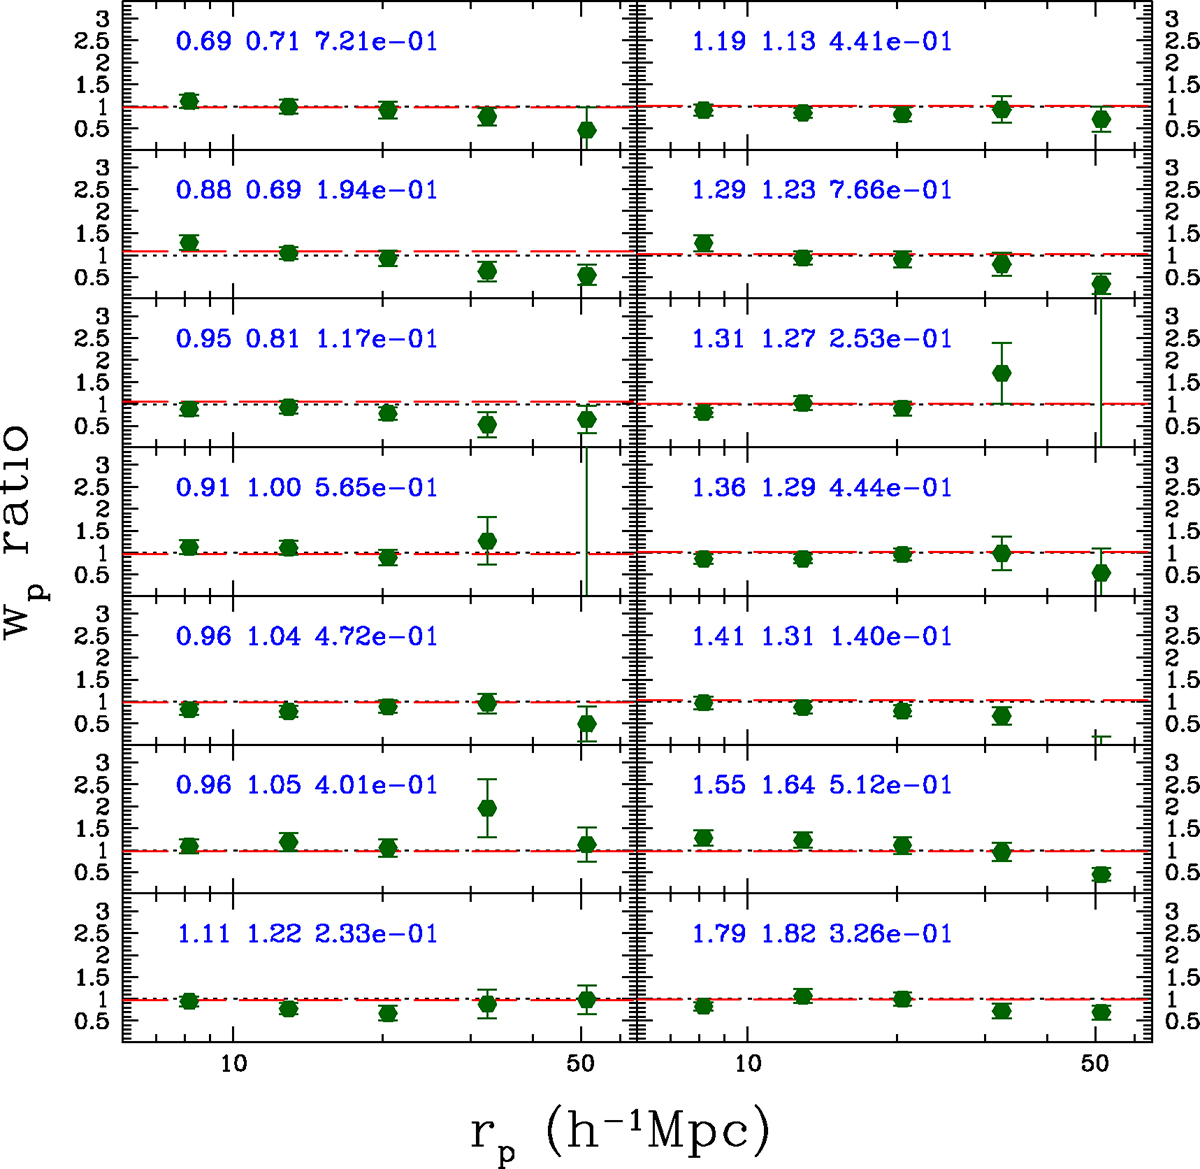
Fig. 3.
Download original image
Ratio of wp, early/wp, late = bearly/blate of the 14 control samples. The pairs are arranged in increasing masses (from top left to bottom left, continuing from top right to bottom right). In each panel, the red horizontal dashed line denotes the theoretically expected bias ratio rb, th (in the absence of AB); the 3 numbers shown in blue are the masses of the early-analogous and late-analogous clusters (in unit of 1014 h−1 M⊙), and the probability for the pair to be drawn from the same parent population.
Current usage metrics show cumulative count of Article Views (full-text article views including HTML views, PDF and ePub downloads, according to the available data) and Abstracts Views on Vision4Press platform.
Data correspond to usage on the plateform after 2015. The current usage metrics is available 48-96 hours after online publication and is updated daily on week days.
Initial download of the metrics may take a while.