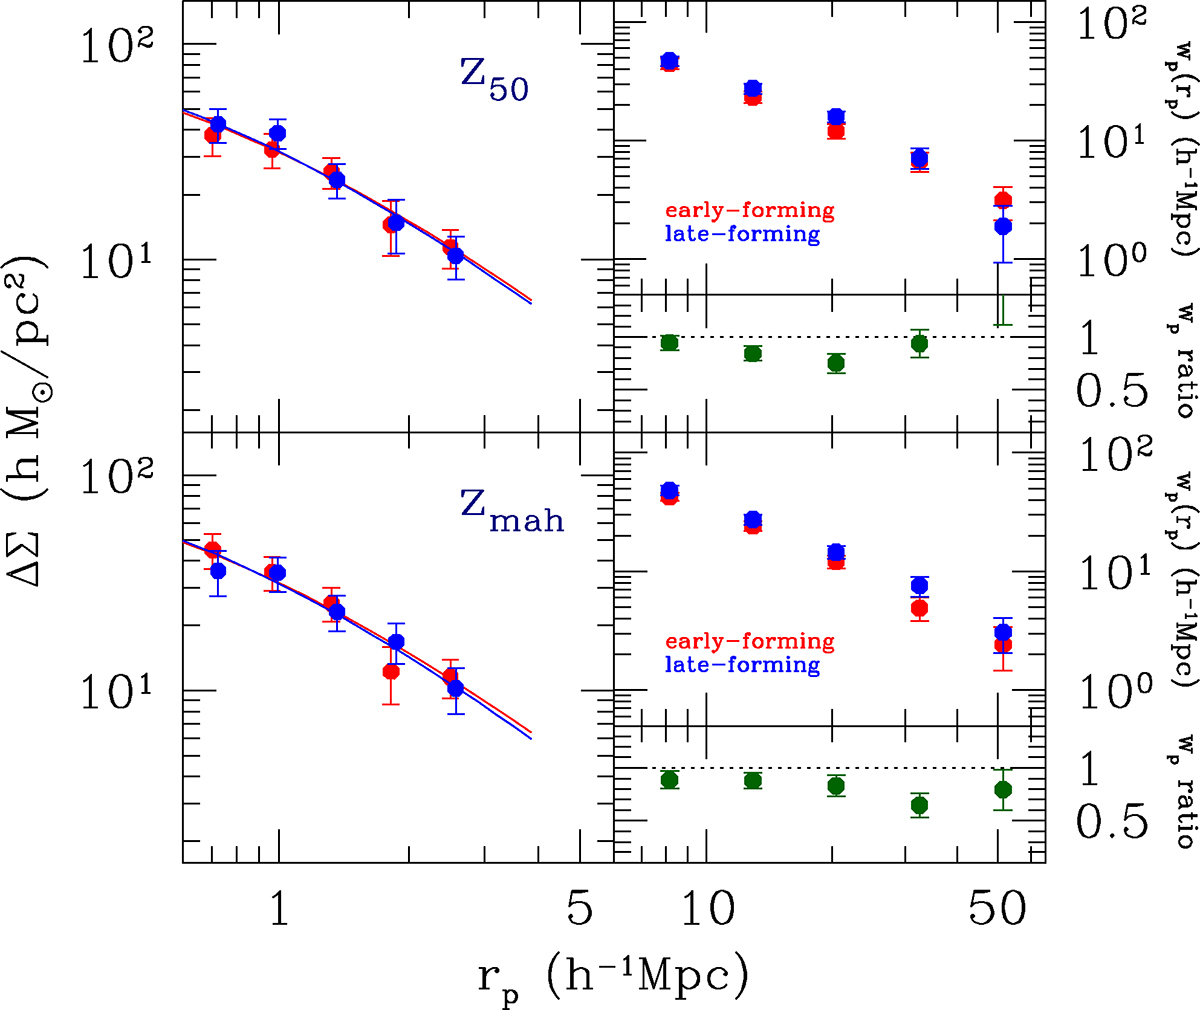
Fig. 1.
Download original image
Weak lensing (more specifically, the excess surface mass density, left) and clustering (right) measurements as a function of projected distance for clusters split in half by z50 (upper panels) and zmah (lower panels). The red and blue symbols represent early- and late-forming clusters, respectively. There are 323 and 311 early- and late-forming clusters when split by z50, div = 0.521, while 316 and 318 clusters when split by zmah, div = 0.469. WL masses for these samples are all very close, about 1.5 × 10¹⁴ h−1 M⊙ (the curves in the left panels show the best-fit models). The green points in the lower right panel are the ratio of the early-to-late wp measurements, which is equivalent to the large-scale bias ratio bearly/blate. The signature of AB at cluster scales is manifested by bearly/blate < 1, which is consistent with our measurements. The probability for these samples to be drawn from the same parent sample is p = 0.0258 (for the z50-selected samples) and p = 0.0295 (for the zmah-selected ones).
Current usage metrics show cumulative count of Article Views (full-text article views including HTML views, PDF and ePub downloads, according to the available data) and Abstracts Views on Vision4Press platform.
Data correspond to usage on the plateform after 2015. The current usage metrics is available 48-96 hours after online publication and is updated daily on week days.
Initial download of the metrics may take a while.