Fig. 6.
Download original image
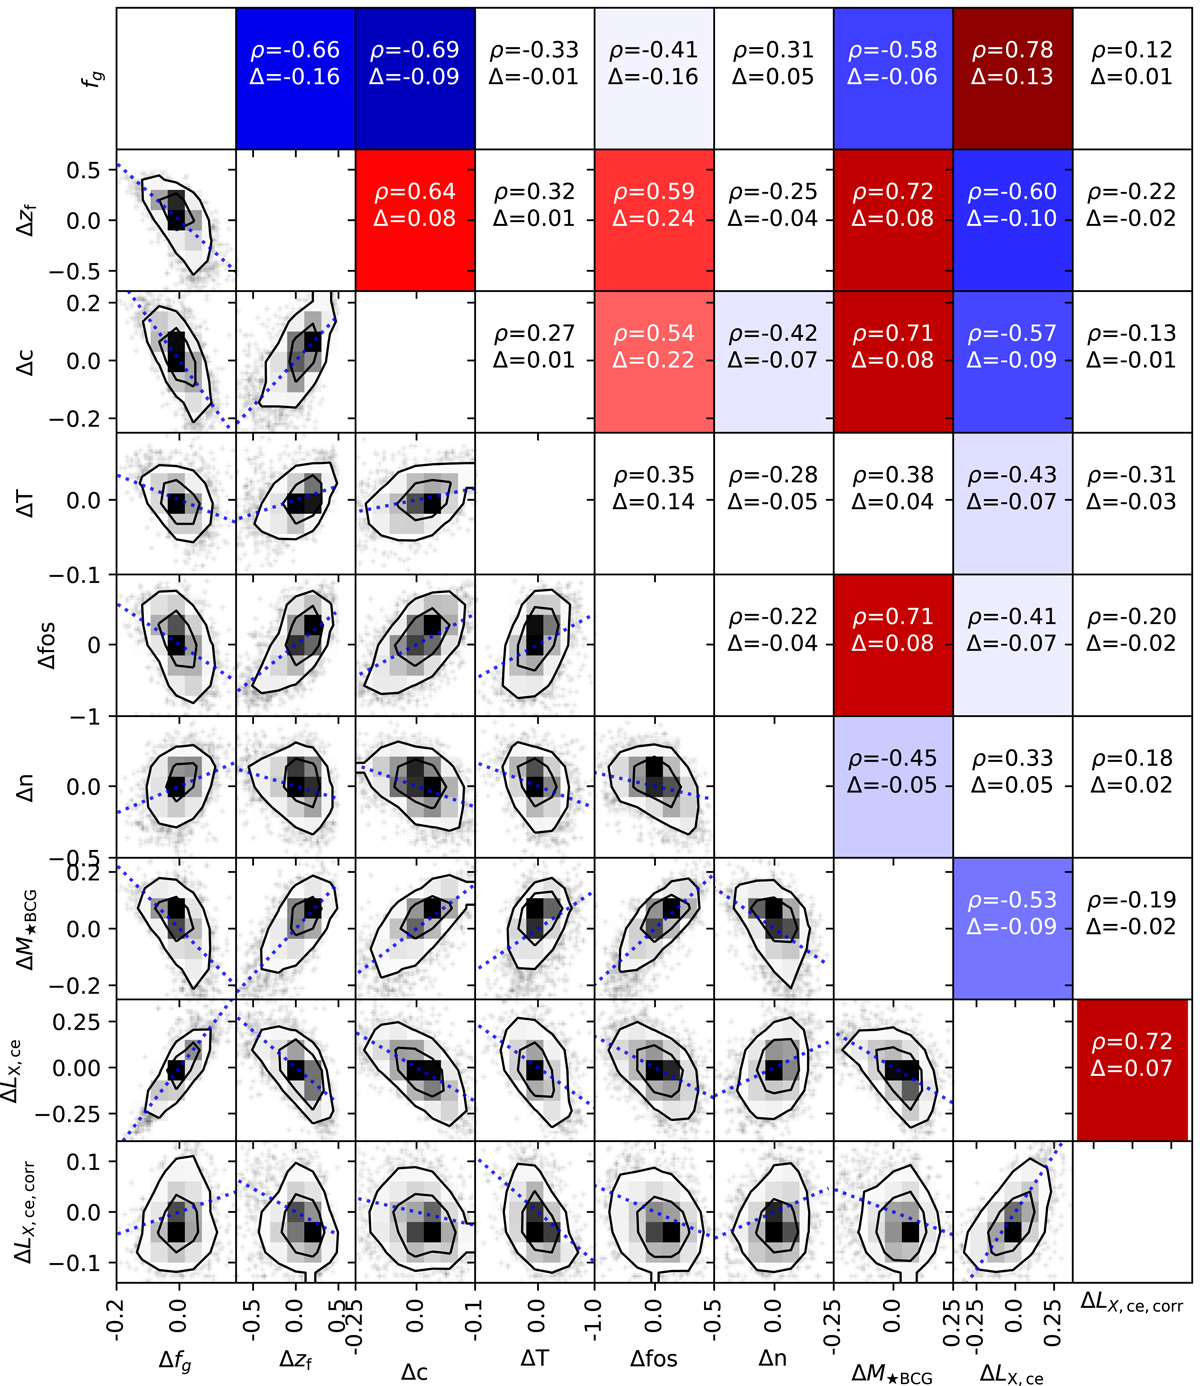
Correlation between cluster properties. Lower triangle: scatter plot of the residuals at fixed halo mass M500c of log10 gas fraction fg, log10 formation redshift zf, log10 concentration c, log10 temperature, log10 fossilness, log10 richness n, log10 X-ray luminosity, and log10 ![]() corrected luminosity (as in Eq. (1)). The dotted lines show the slope for individual correlation coefficients. When it points in a direction different from the data elongation, it indicates that the data do not satisfy the assumption for the derivation of the correlation coefficient. The upper triangle shows the corresponding correlation coefficient ρ and the amplitude of the covariance Δ.
corrected luminosity (as in Eq. (1)). The dotted lines show the slope for individual correlation coefficients. When it points in a direction different from the data elongation, it indicates that the data do not satisfy the assumption for the derivation of the correlation coefficient. The upper triangle shows the corresponding correlation coefficient ρ and the amplitude of the covariance Δ.
Current usage metrics show cumulative count of Article Views (full-text article views including HTML views, PDF and ePub downloads, according to the available data) and Abstracts Views on Vision4Press platform.
Data correspond to usage on the plateform after 2015. The current usage metrics is available 48-96 hours after online publication and is updated daily on week days.
Initial download of the metrics may take a while.