Open Access
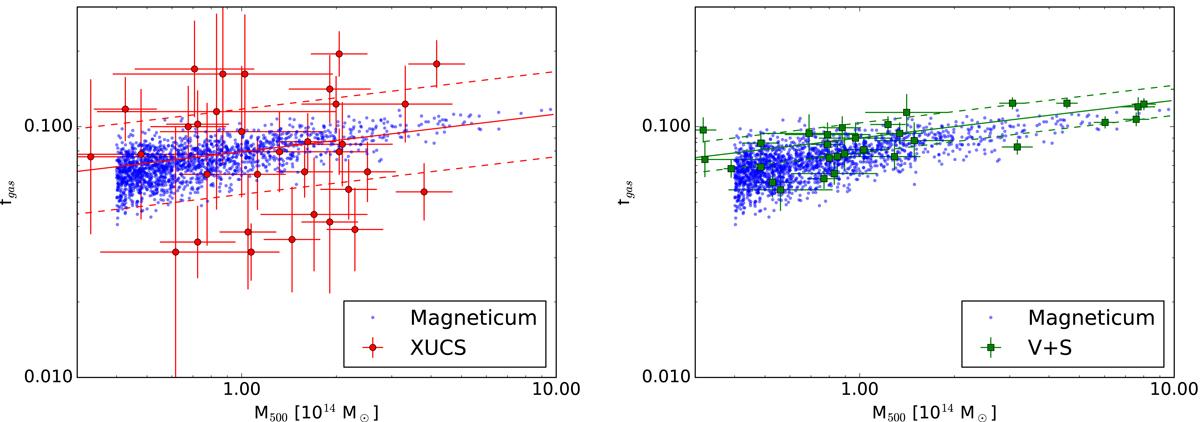
Fig. 2.
Download original image
Gas fraction in an X-ray unbiased sample (red points, left panel), in the X-ray selected sample (green points, right panel), and in the Magneticum simulation (blue points, both panels). Best fit and ±1σ intrinsic scatter corridors are also shown. Photometric errors of the observational samples boost the data scatter.
Current usage metrics show cumulative count of Article Views (full-text article views including HTML views, PDF and ePub downloads, according to the available data) and Abstracts Views on Vision4Press platform.
Data correspond to usage on the plateform after 2015. The current usage metrics is available 48-96 hours after online publication and is updated daily on week days.
Initial download of the metrics may take a while.