Fig. 7.
Download original image
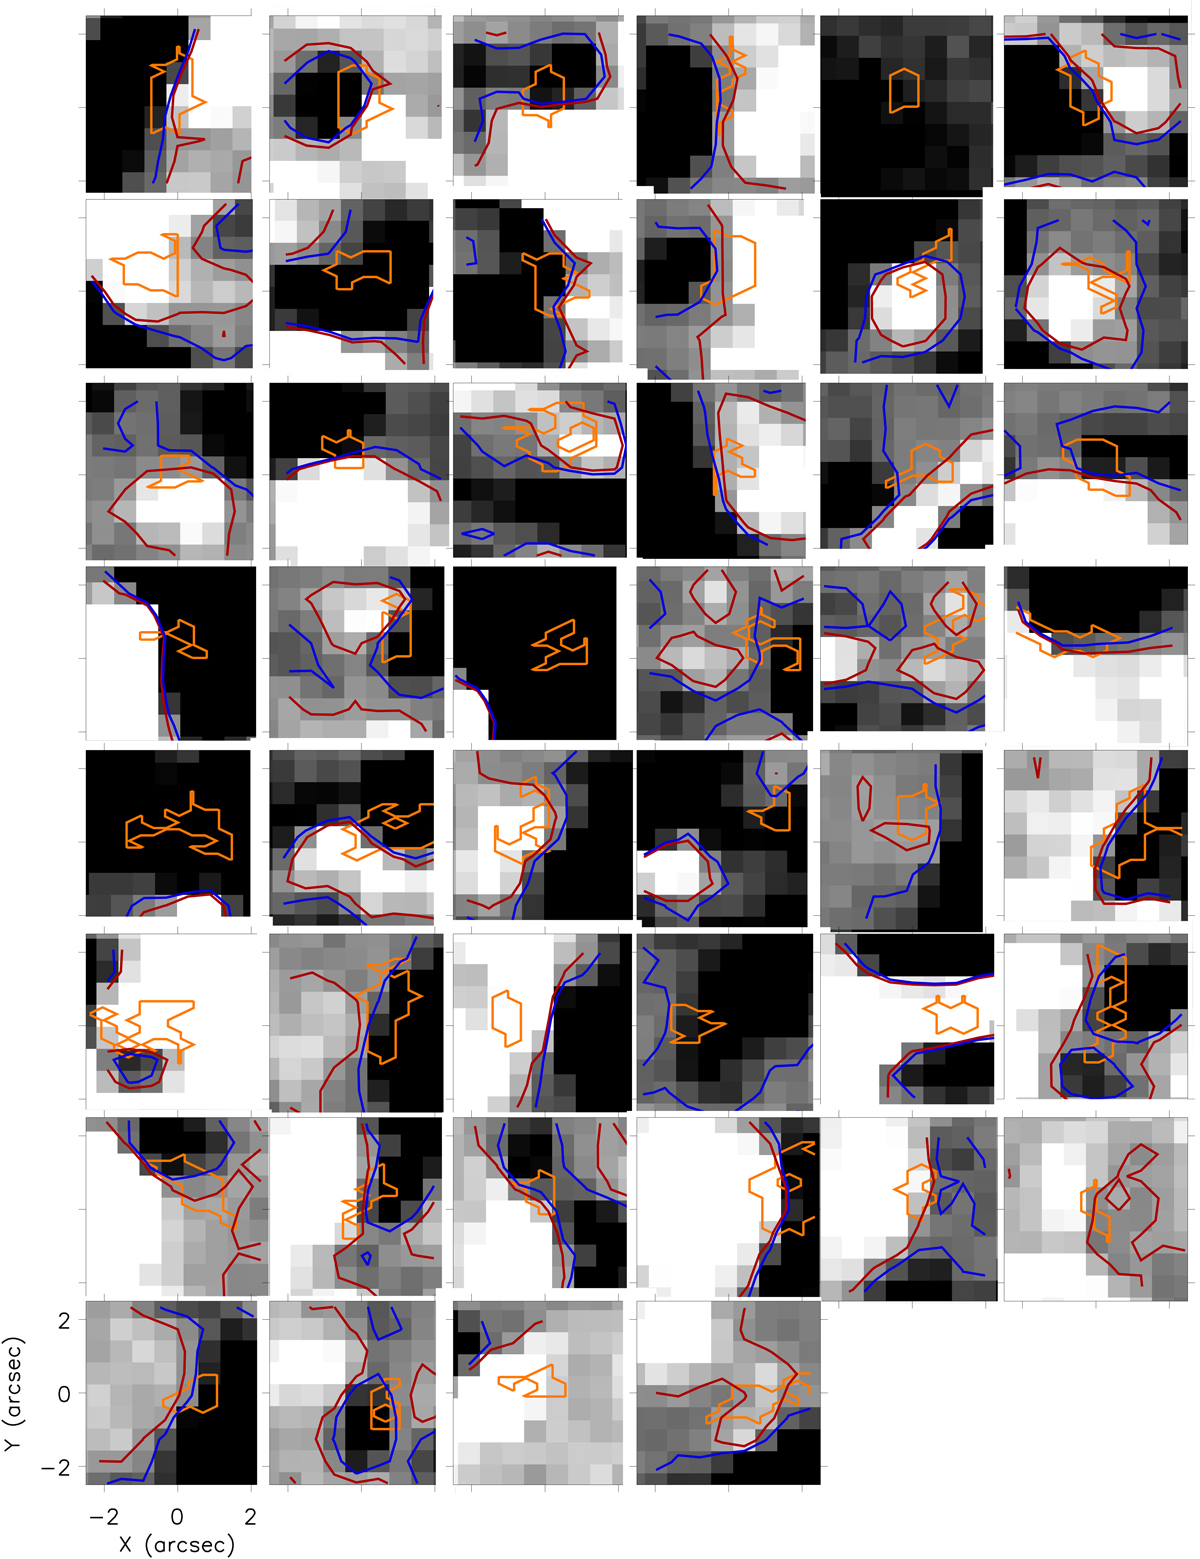
LOS magnetic field maps co-spatial to the 46 parent IRIS bursts with measured areas between 1 arcsec2 and 4 arcsec2. Each plot covers a region of 5″ × 5″ centred on the location of the parent IRIS burst from the closest SDO/HMI image in time, de-rotated to the time of IRIS burst profile detection. The red and blue contours outline regions of positive and negative magnetic fields saturated at 20 G and −20 G, respectively, whilst the orange contours outline the approximate locations of the parent IRIS bursts. Opposite polarity magnetic fields are found within the FOV for 43 (93%) of these parent IRIS bursts.
Current usage metrics show cumulative count of Article Views (full-text article views including HTML views, PDF and ePub downloads, according to the available data) and Abstracts Views on Vision4Press platform.
Data correspond to usage on the plateform after 2015. The current usage metrics is available 48-96 hours after online publication and is updated daily on week days.
Initial download of the metrics may take a while.