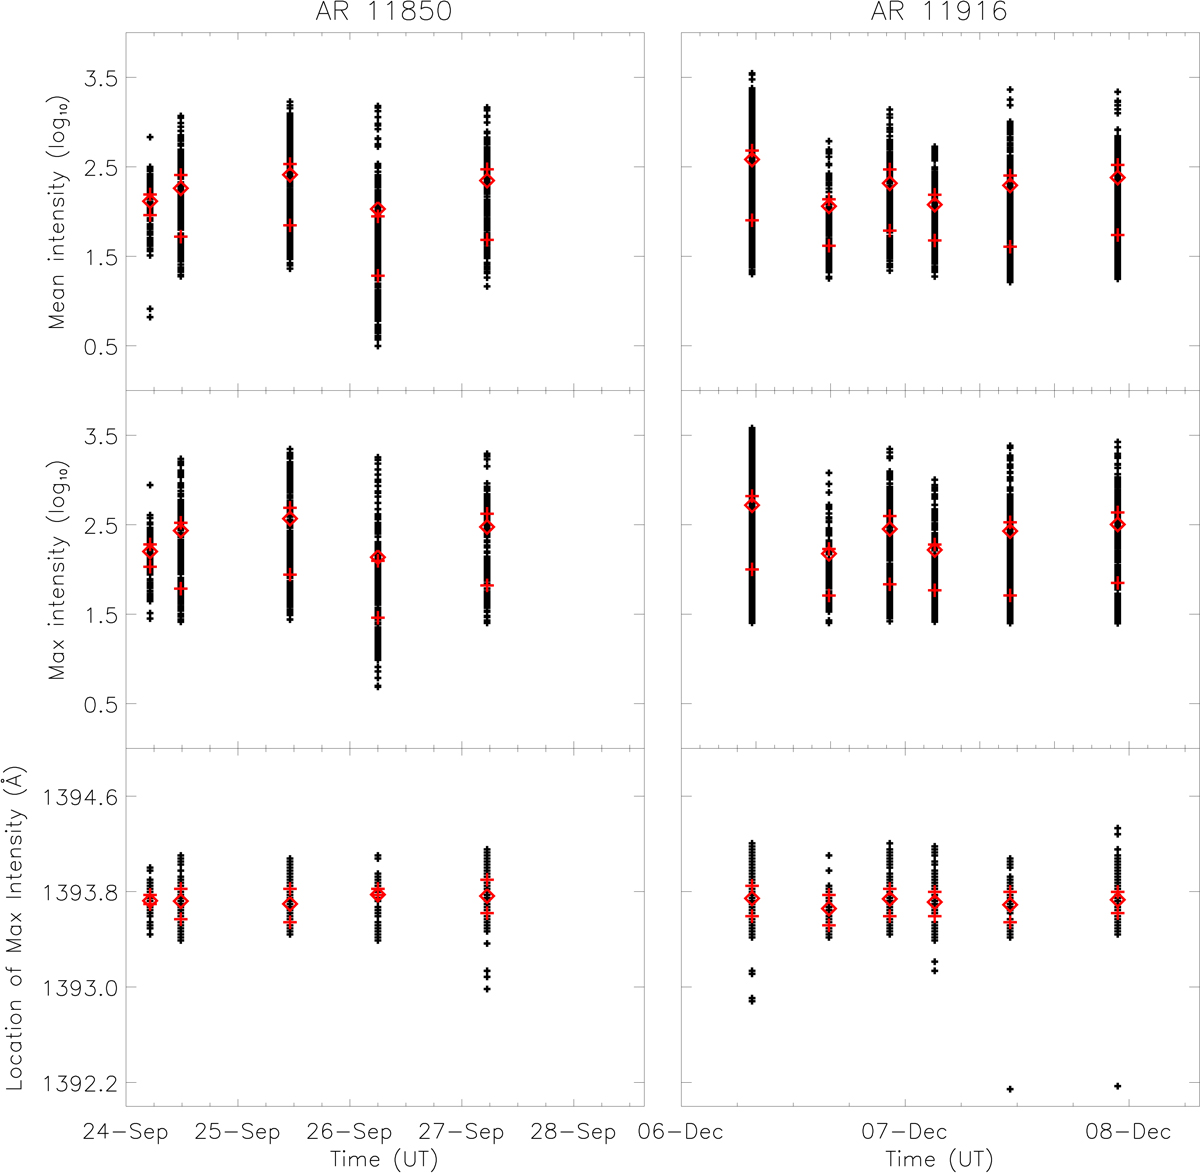
Fig. 6.
Download original image
Distributions of various spectral parameters for all IRIS burst profiles identified within datasets sampling ARs 11850 (left-hand panels) and 11916 (right-hand panels). Only datasets which returned more than 100 IRIS burst profiles were considered. Top panels: logarithmic mean intensity from a ±0.075 Å window surrounding the Si IV 1394 Å line core calculated for each IRIS burst profile. Middle panels: logarithmic maximum intensity for each IRIS burst profile. Bottom panels: spectral location of the maximum intensity of each IRIS burst profile. The diamonds indicate the mean for each raster, while the upper and lower crosses indicate the 75th and 25th percentiles, respectively. No systematic or monotonic changes in these parameters through time are apparent.
Current usage metrics show cumulative count of Article Views (full-text article views including HTML views, PDF and ePub downloads, according to the available data) and Abstracts Views on Vision4Press platform.
Data correspond to usage on the plateform after 2015. The current usage metrics is available 48-96 hours after online publication and is updated daily on week days.
Initial download of the metrics may take a while.