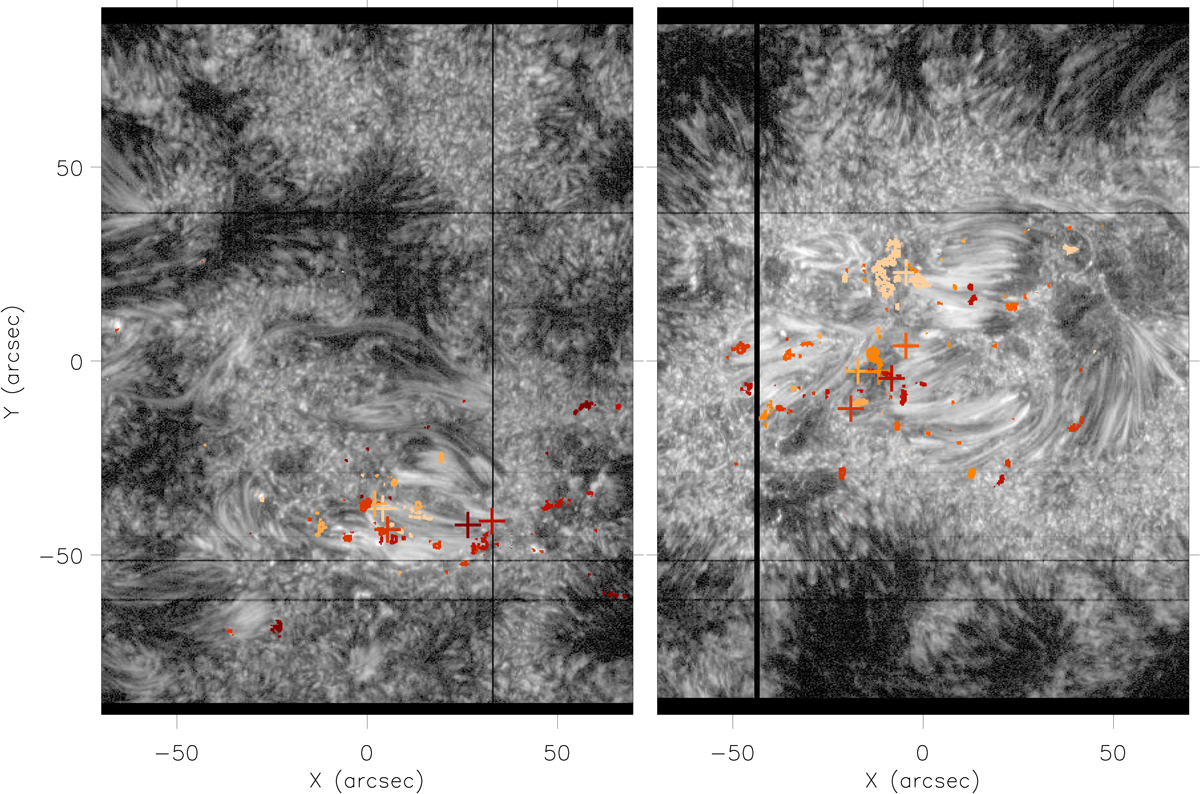
Fig. 5.
Download original image
Spatial positions of IRIS burst profiles through time in two datasets. Left-hand panel: map of the Si IV 1394 Å line core intensity (logarithmically scaled) within AR 11850 sampled during the raster starting at 05:59:43 UT on 26th September 2013. Right-hand panel: same as the left-hand panel but for AR 11916 sampled during the raster starting at 03:09:49 UT on 7th December 2013. The contours and crosses over-laid on both panels denote the IRIS burst profiles and their centres-of-mass, respectively, for each raster containing more than 100 automatically detected IRIS burst profiles. The colours indicate different rasters and are consistent with those used in the right-hand panel of Fig. 4.
Current usage metrics show cumulative count of Article Views (full-text article views including HTML views, PDF and ePub downloads, according to the available data) and Abstracts Views on Vision4Press platform.
Data correspond to usage on the plateform after 2015. The current usage metrics is available 48-96 hours after online publication and is updated daily on week days.
Initial download of the metrics may take a while.