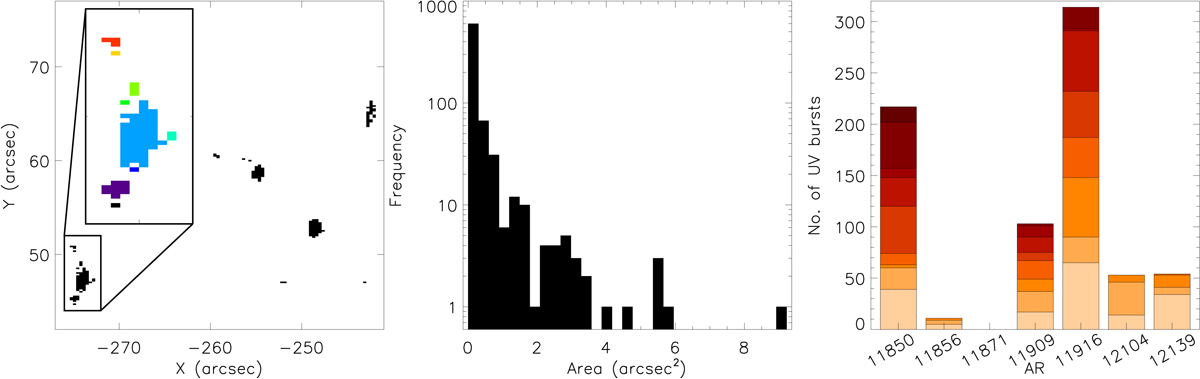
Fig. 4.
Download original image
Structuring of IRIS burst profiles in these datasets. Left-hand panel: binary map showing the locations of IRIS burst profiles (black pixels) identified within a single raster sampling AR 11850. Four of the parent IRIS bursts within this raster correspond to the four events studied in Peter et al. (2014). The over-lying cut-out displays how connected objects are combined to form parent IRIS bursts, with nine events (all individually coloured) occurring in this small region. Middle panel: histogram of parent IRIS burst area against frequency constructed using all 42 datasets, where the y-axis is plotted in logarithmic scale. Each bar is binned over a range of 0.3 arcsec2 (corresponding to five pixels). Right-hand panel: bar chart plotting the number of parent IRIS bursts by AR. The different coloured sections of each bar indicate the number of parent IRIS bursts identified in different rasters sampling that AR, with the light yellow at the bottom corresponding to the first raster within which IRIS bursts were detected using automated methods for that specific AR. The progressively darker colours up the bars correspond to the subsequent rasters within which IRIS bursts were detected. The physical number of bursts plotted in each bar segment can be found in Table A.1.
Current usage metrics show cumulative count of Article Views (full-text article views including HTML views, PDF and ePub downloads, according to the available data) and Abstracts Views on Vision4Press platform.
Data correspond to usage on the plateform after 2015. The current usage metrics is available 48-96 hours after online publication and is updated daily on week days.
Initial download of the metrics may take a while.