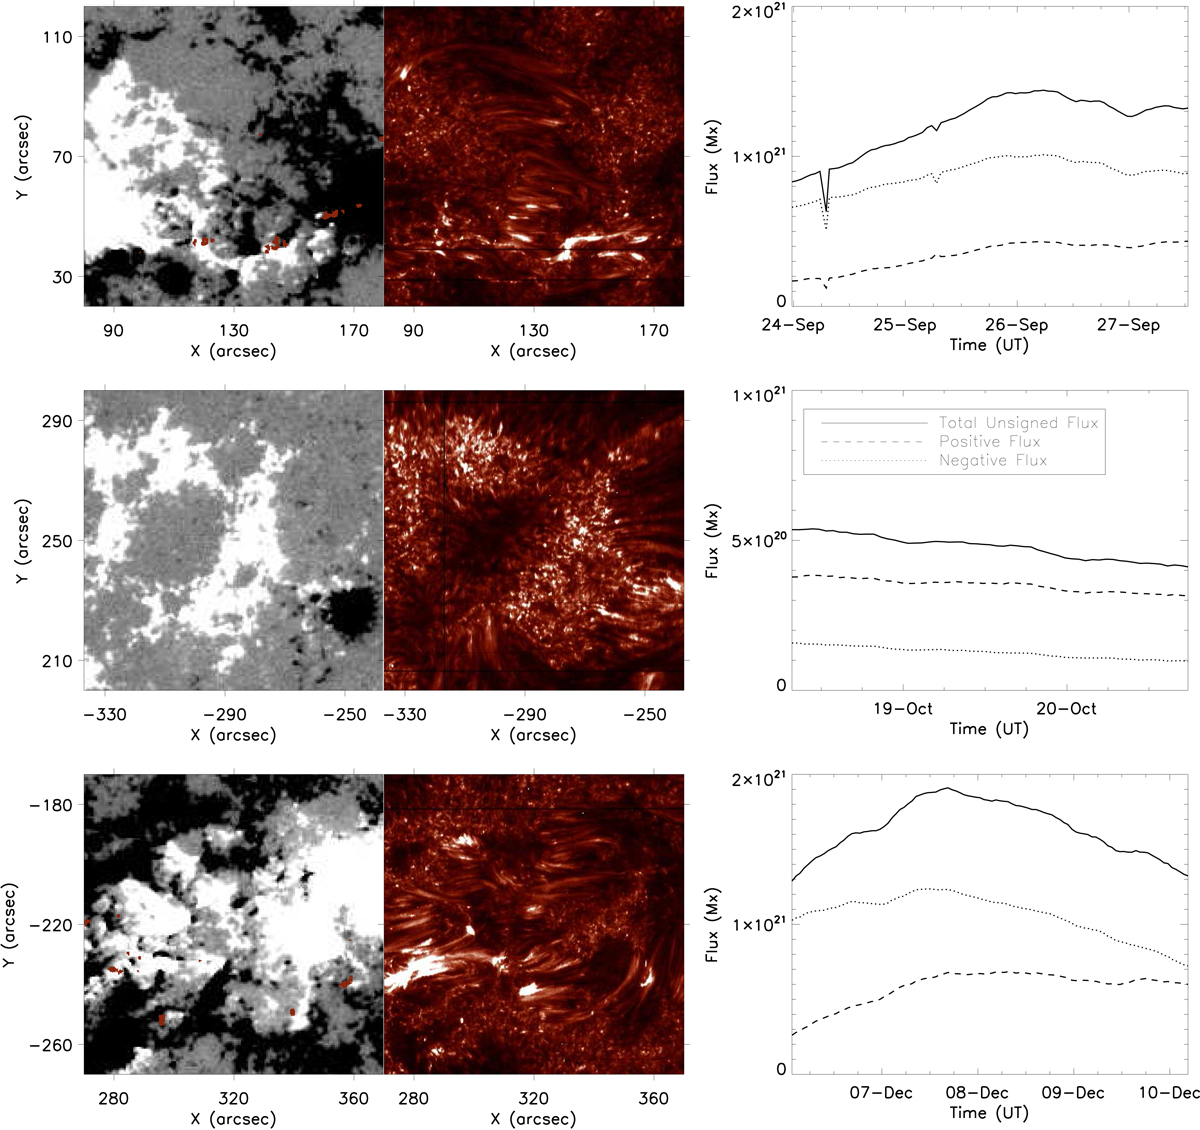
Fig. 3.
Download original image
Context plots for three of the ARs, namely ARs 11850, 11871, and 11916 from top to bottom, studied. Left-hand column: zoomed 100″ × 100″ SDO/HMI magnetic context images. The plotted frames were selected as they contained the peak total unsigned magnetic flux for these regions during the time studied. Middle column: Si IV 1394 Å line core intensity sampled from the IRIS raster with start time closest to the SDO/HMI images plotted in the left hand column. The pointing of the IRIS FOV was de-rotated to the SDO/HMI observation time. Right-hand column: evolution of the total unsigned (solid lines), positive (dashed lines), and negative (dotted lines) magnetic flux within the wider 180″ × 180″ FOV through the time-period studied here for each AR. The red contours over-laid on the left-hand column outline the IRIS burst profiles returned using automated methods from the IRIS raster plotted in the respective middle column. The five ARs with the highest peak magnitudes of the unsigned flux were found to contain the majority of the IRIS burst profiles identified here.
Current usage metrics show cumulative count of Article Views (full-text article views including HTML views, PDF and ePub downloads, according to the available data) and Abstracts Views on Vision4Press platform.
Data correspond to usage on the plateform after 2015. The current usage metrics is available 48-96 hours after online publication and is updated daily on week days.
Initial download of the metrics may take a while.