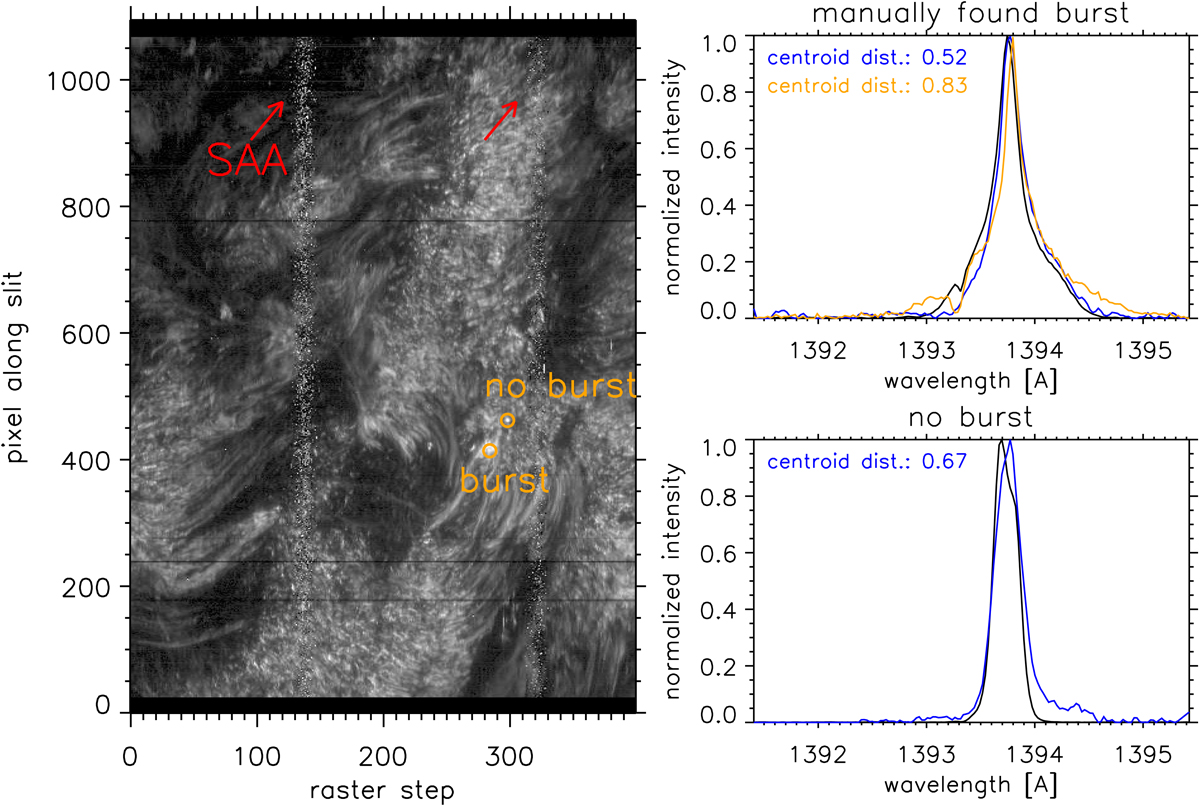
Fig. 2.
Download original image
Example of IRIS burst profiles missed by the algorithm. Left-hand panel: intensity of the FOV during the fourth IRIS raster sampling AR 12104 at the core wavelength of the Si IV 1394 line (logarithmically scaled to enhance contrast). Our algorithm did not identify any bursts in this raster. The two times during which IRIS passed through the SAA, thereby causing noisy spectra, during this observation are marked by red arrows. The orange circles locate two pixels whose spectra are shown in the right-hand panels (black lines), one containing a manually detected burst and the other containing no burst spectra. Right-hand panels: two IRIS spectra selected to demonstrate how a small number of IRIS burst profiles may be missed by the algorithm. The top panel plots a manually detected IRIS burst with a clear, albeit shallow, absorption blend over-laid on the Si IV 1394 Å line, while the bottom panel is a typical non-burst spectrum. Both spectra are normalised to their peak intensity. We over-plot the mathematically closest reference spectrum considered by the algorithm to each of these profiles (blue lines), which in both cases is a non-burst reference spectrum. Therefore, no IRIS burst profile is found for either pixel by the algorithm. The nearest IRIS burst reference spectrum to the manually detected IRIS burst profile is also over-plotted on the top panel for reference (orange line).
Current usage metrics show cumulative count of Article Views (full-text article views including HTML views, PDF and ePub downloads, according to the available data) and Abstracts Views on Vision4Press platform.
Data correspond to usage on the plateform after 2015. The current usage metrics is available 48-96 hours after online publication and is updated daily on week days.
Initial download of the metrics may take a while.