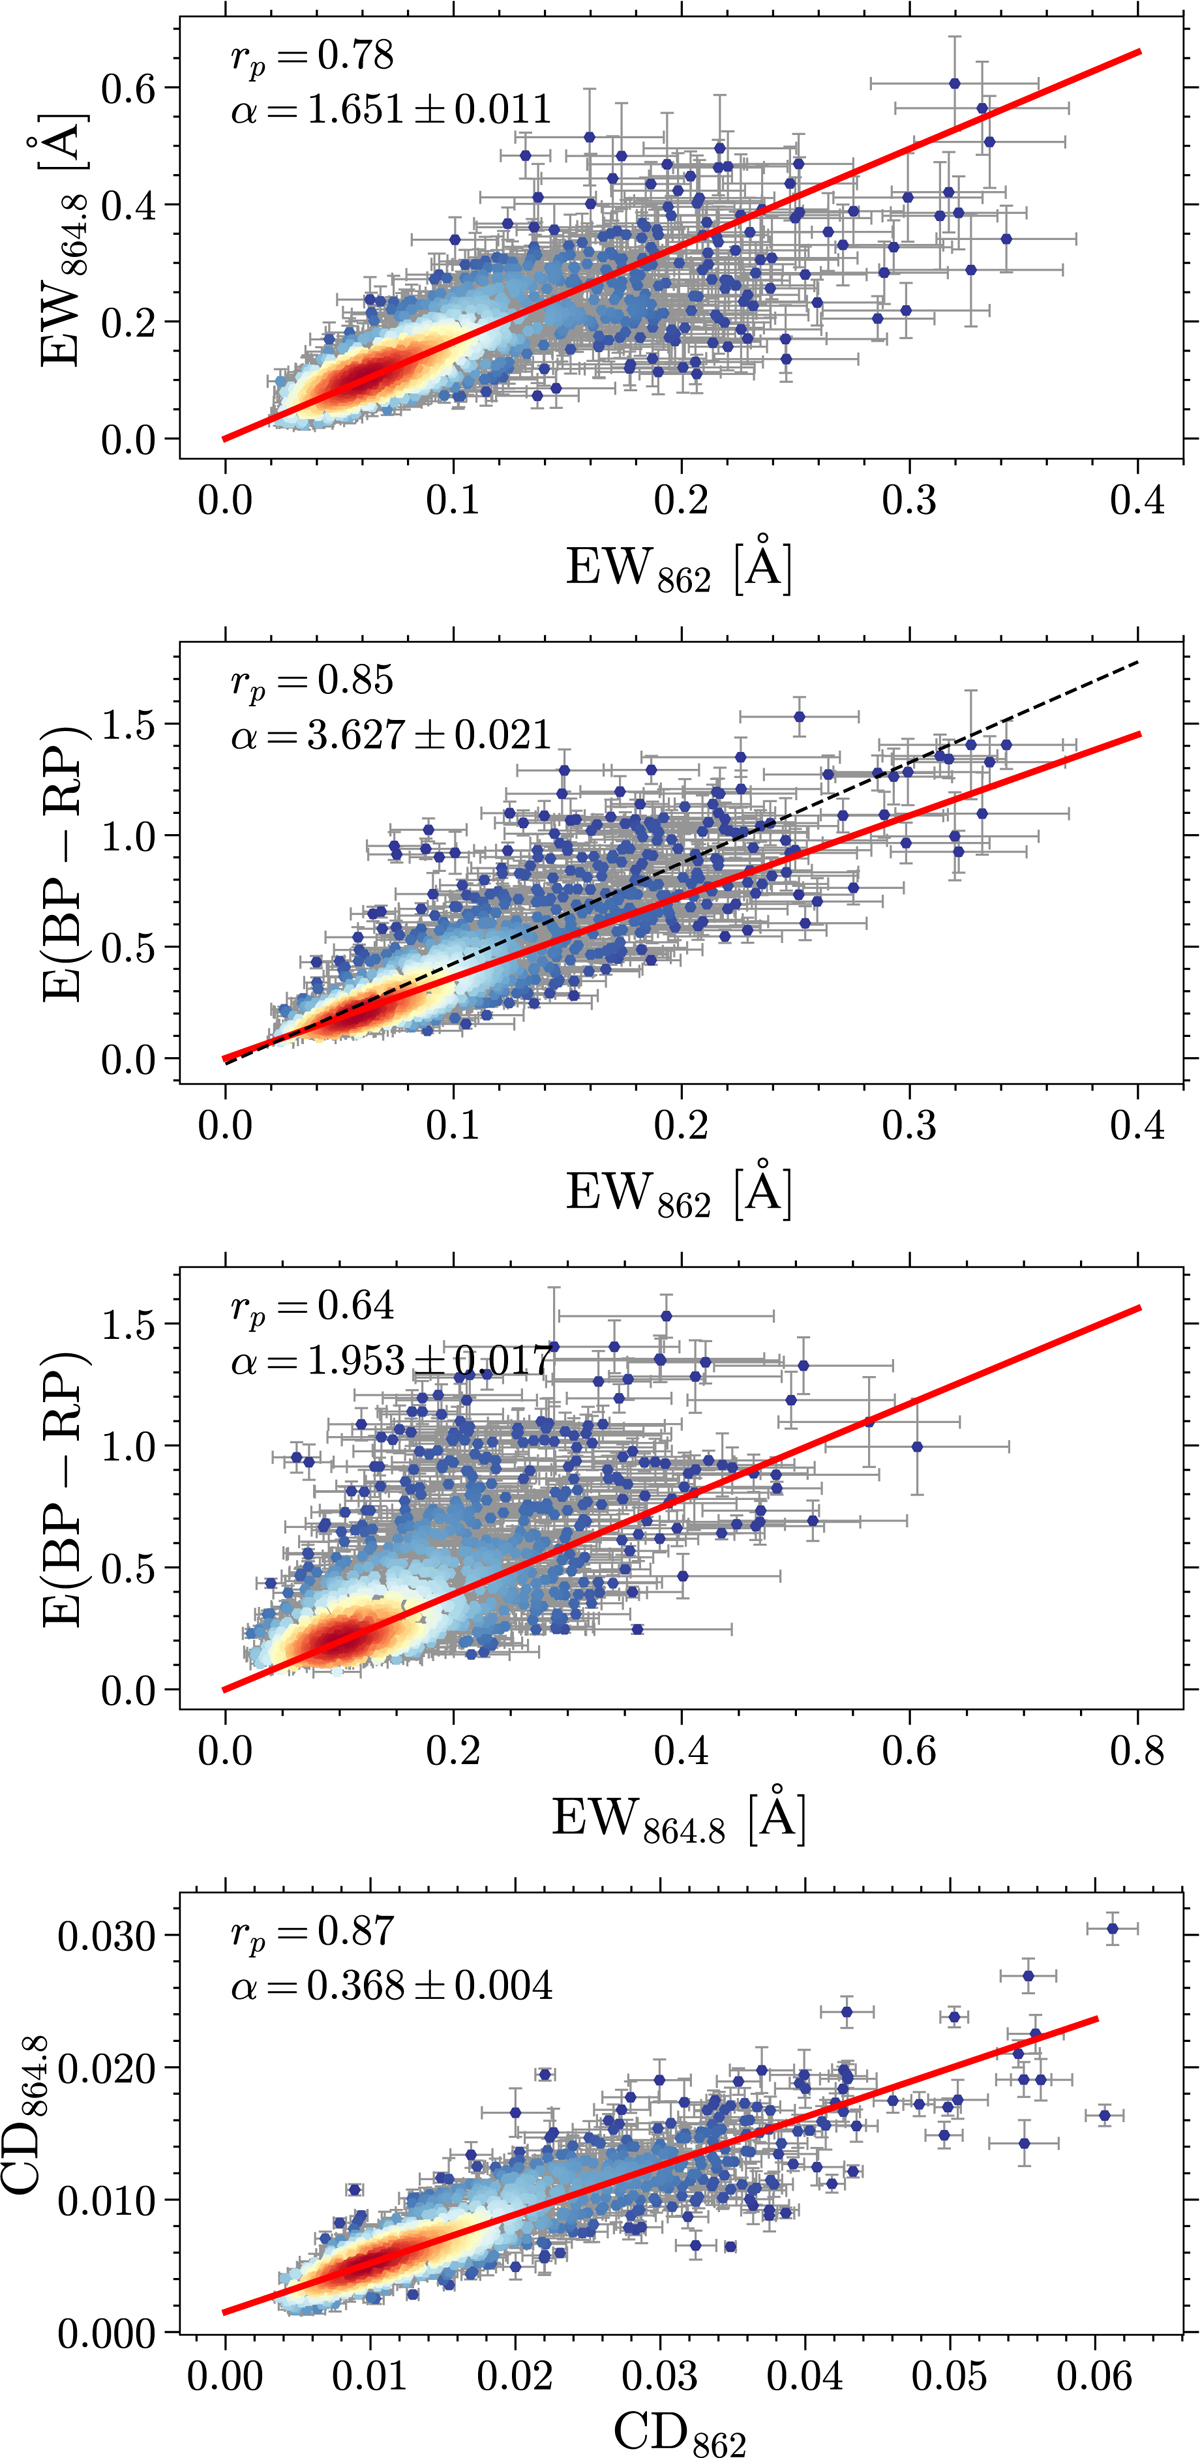
Fig. 4.
Download original image
Intensity correlations between λ862, λ864.8, and E(BP − RP). Different correlations are shown in each panel with the Pearson coefficient (rp) and the slope of a 2σ-clipped linear fit (α) with zero intercept shown in red. Data points with error bars are colored by their number density estimated by a Gaussian KDE. The black dashed line shown in the second panel from the top is the linear relation derived in Gaia Collaboration (2022d).
Current usage metrics show cumulative count of Article Views (full-text article views including HTML views, PDF and ePub downloads, according to the available data) and Abstracts Views on Vision4Press platform.
Data correspond to usage on the plateform after 2015. The current usage metrics is available 48-96 hours after online publication and is updated daily on week days.
Initial download of the metrics may take a while.