Fig. 2.
Download original image
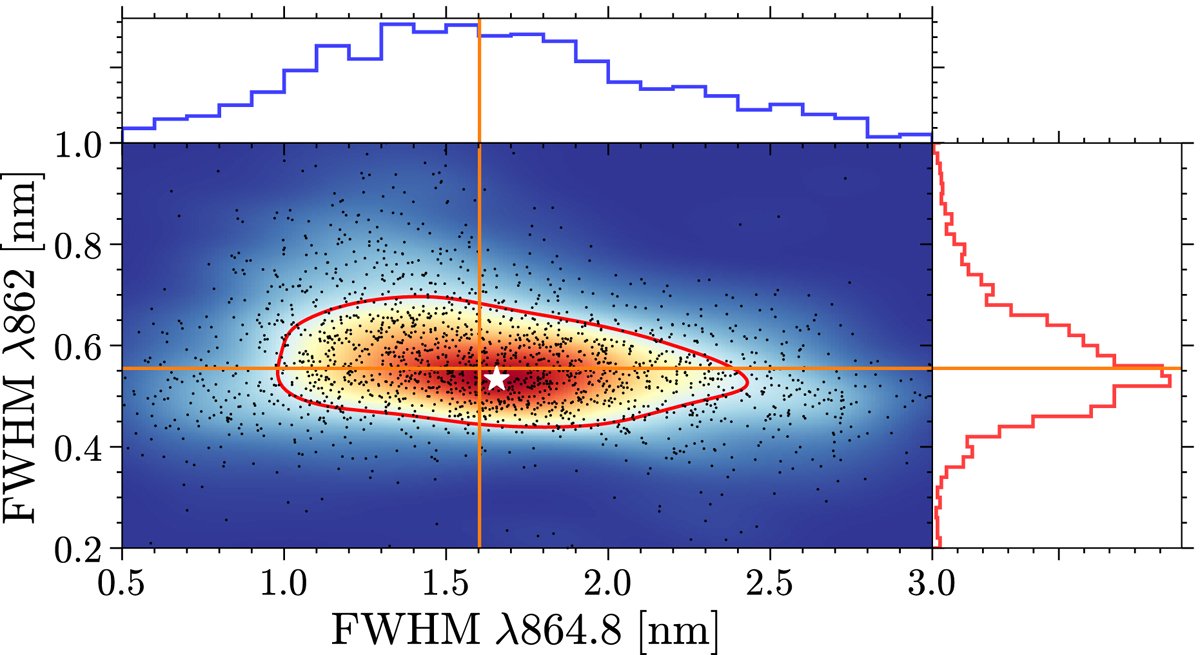
Distributions of the FWHM of λ862 (red histogram) and λ864.8 (blue histogram), as well as their joint distribution (middle colored map), measured in 1962 stacked spectra after applying the general filtering. The colors represent the densities of the joint FWHM distribution, estimated by a Gaussian KDE. The white star indicates the peak density. The red line in the central panel indicates a contour with a probability density of 1.2, about one-third of the peak density. The orange lines indicate the median FWHM of λ862 and λ864.8, respectively.
Current usage metrics show cumulative count of Article Views (full-text article views including HTML views, PDF and ePub downloads, according to the available data) and Abstracts Views on Vision4Press platform.
Data correspond to usage on the plateform after 2015. The current usage metrics is available 48-96 hours after online publication and is updated daily on week days.
Initial download of the metrics may take a while.