Open Access
Fig. 5
Download original image
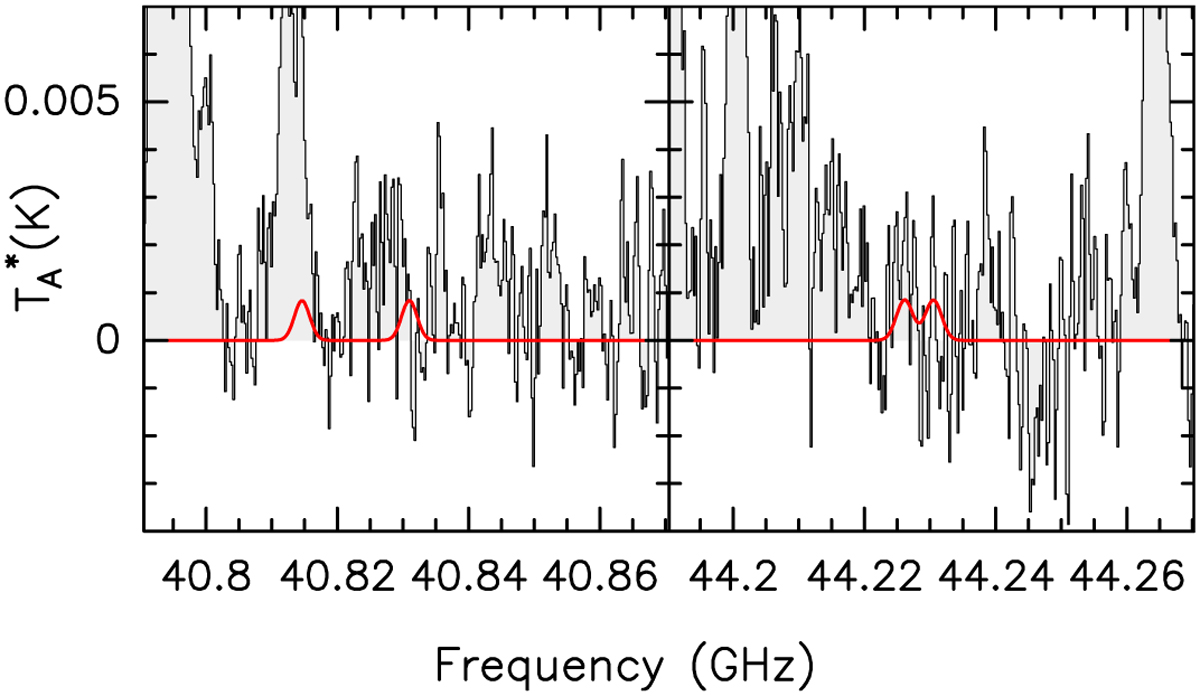
Simulation of acetohydroxamic acid emission at the 3σ upper limit column density derived toward G+0.693-0.027 using the parameters outlined in the text (in red) overlaid on the observations (black line and in gray histogram). The features shown arise from the 61,6–50,5 transition (left) and 70,7–61,6 transition (right).
Current usage metrics show cumulative count of Article Views (full-text article views including HTML views, PDF and ePub downloads, according to the available data) and Abstracts Views on Vision4Press platform.
Data correspond to usage on the plateform after 2015. The current usage metrics is available 48-96 hours after online publication and is updated daily on week days.
Initial download of the metrics may take a while.