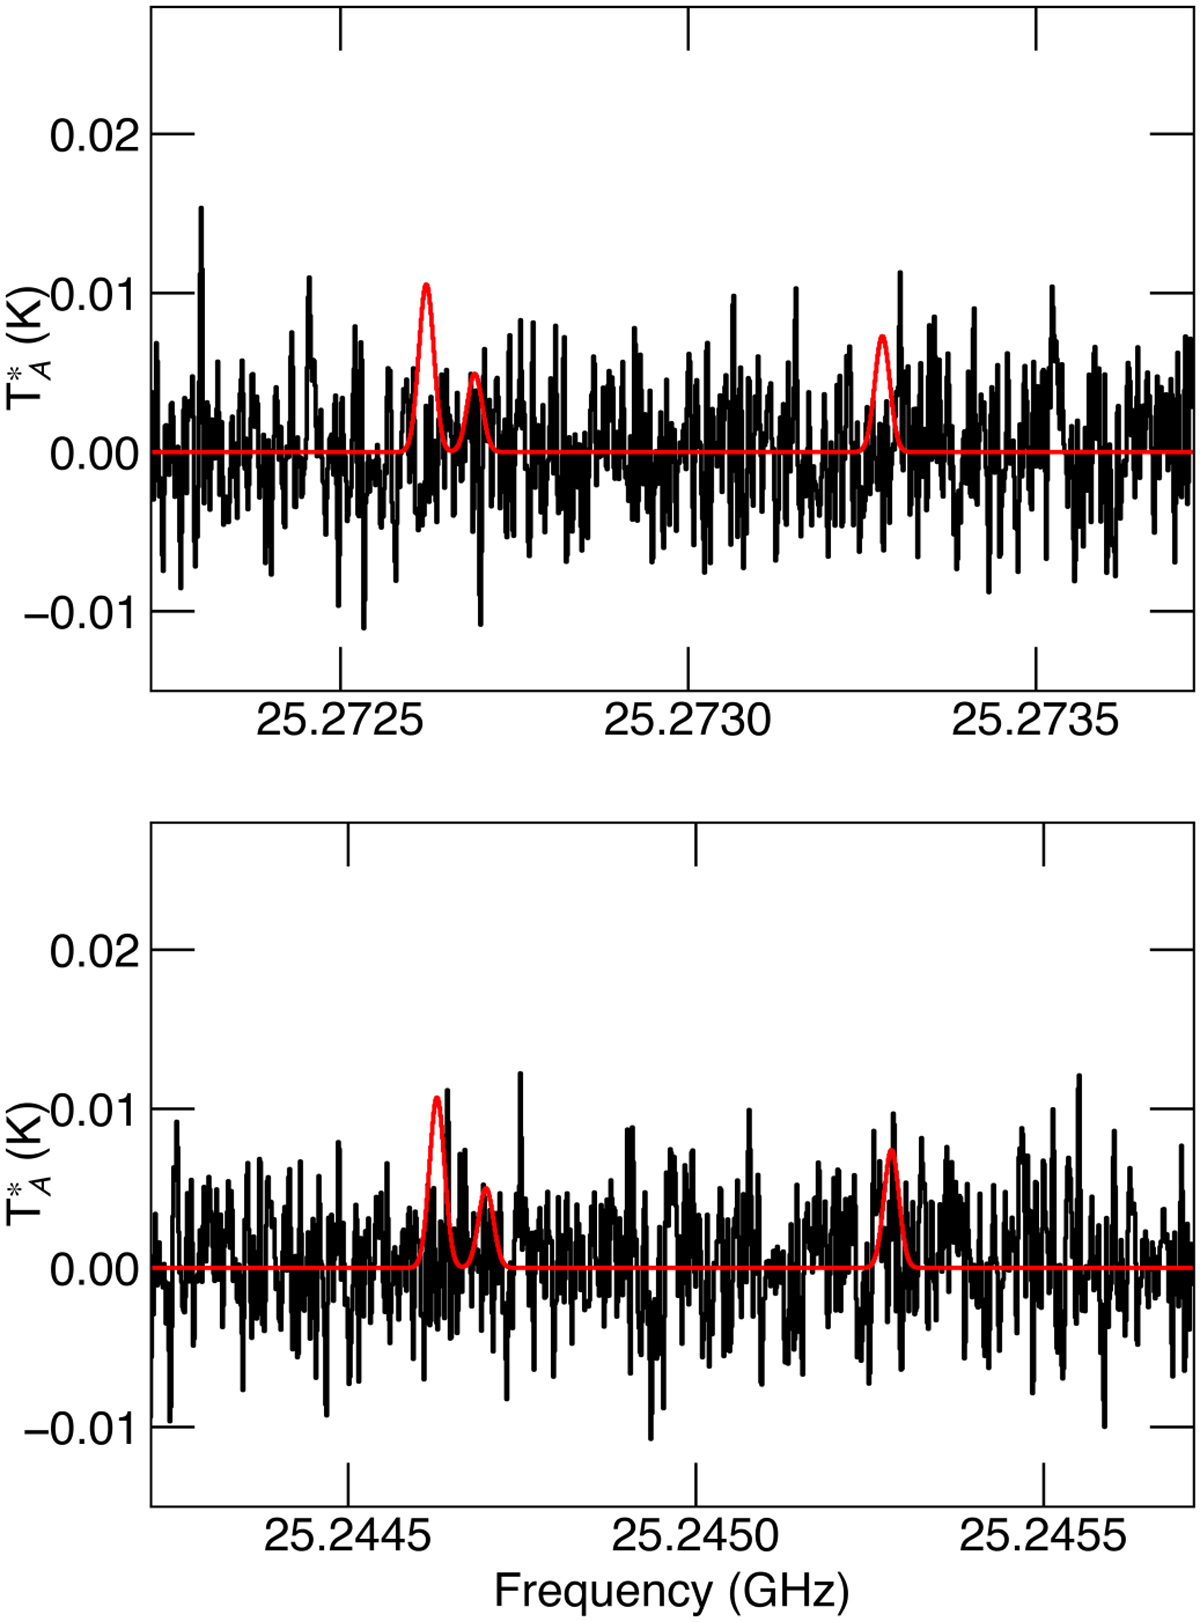
Fig. 4
Download original image
Simulation of acetohydroxamic acid emission at the 3σ upper limit column density derived toward TMC-1 using the parameters outlined in the text (in red) overlaid on the GOTHAM observations of TMC-1 (in black). The features shown arise from the 31,з–20,2 set of transitions. The spectra have been adjusted to the nominal source υlsr = 5.8 km s−1.
Current usage metrics show cumulative count of Article Views (full-text article views including HTML views, PDF and ePub downloads, according to the available data) and Abstracts Views on Vision4Press platform.
Data correspond to usage on the plateform after 2015. The current usage metrics is available 48-96 hours after online publication and is updated daily on week days.
Initial download of the metrics may take a while.