Fig. 7.
Download original image
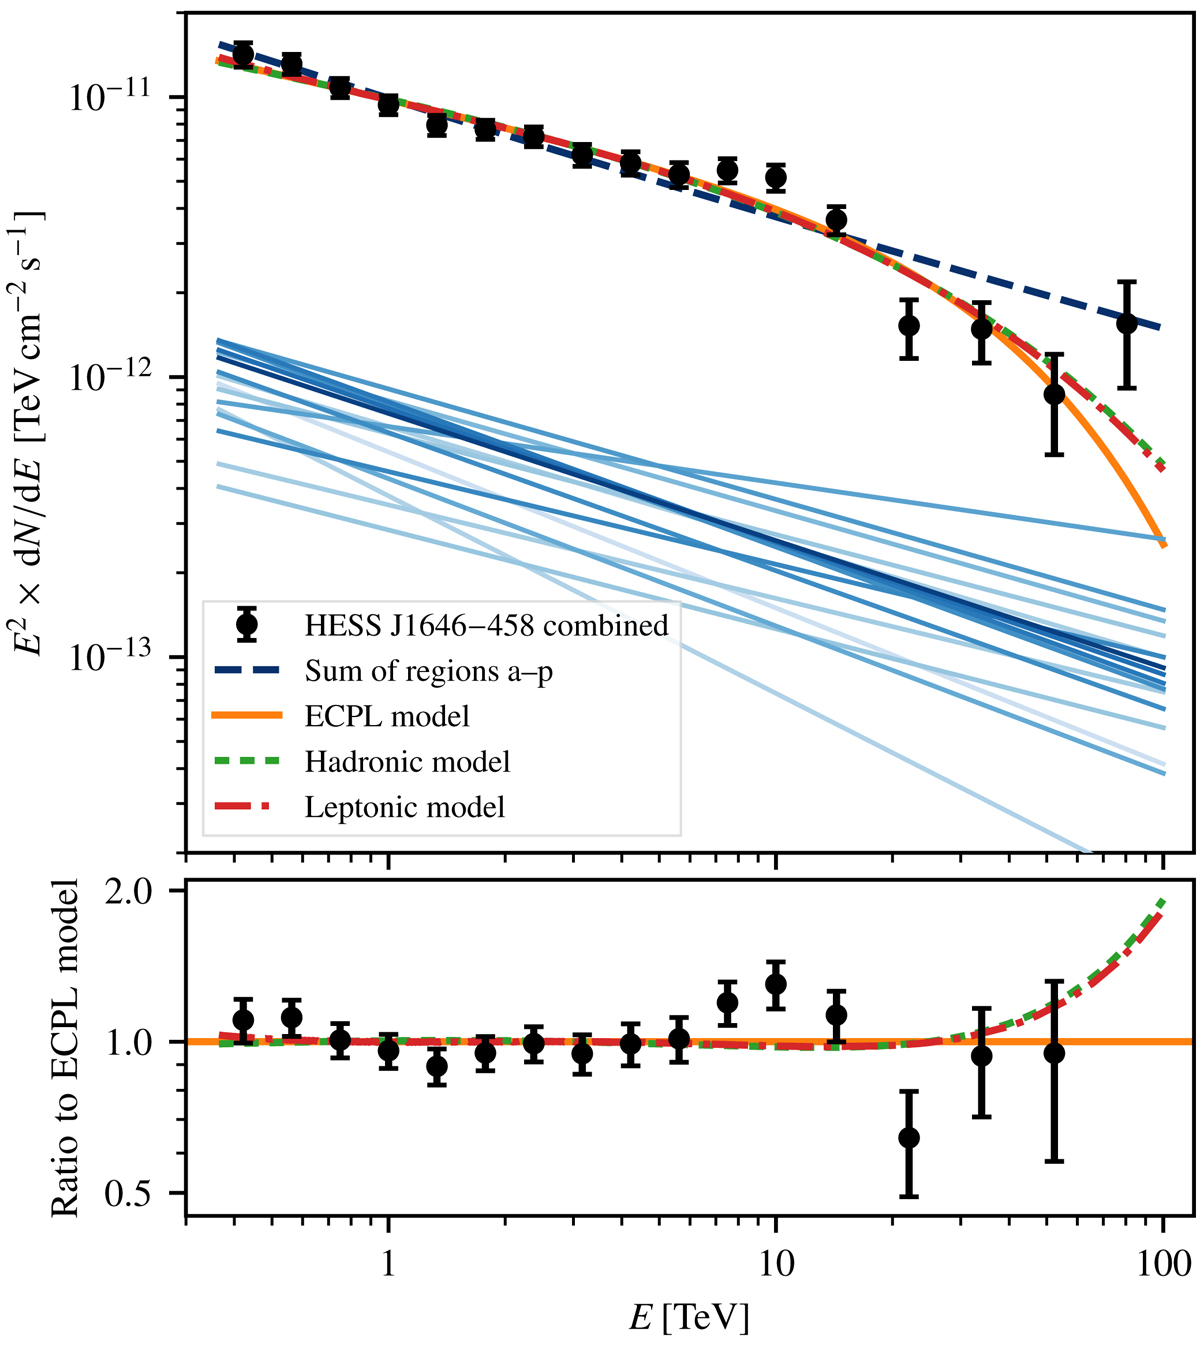
Combined energy spectrum. The black data points correspond to the entire emission of HESS J1646−458; the solid orange, dashed green, and dashed-dotted red lines show the result of fitting a power law with exponential cut-off (ECPL), a hadronic (pp) model, and a leptonic (IC) model, respectively, to these points. Fitted power-law models for each region a–p are displayed by solid blue lines (with darker shades indicating closer proximity to Westerlund 1), while the dashed blue line denotes their sum. All power-law spectra are plotted up to 100 TeV for better visibility, however, the observed γ-ray excess is not significant up to this energy in any of the sub-regions. Bottom panel: ratio to the ECPL model; note that the last flux point (with a ratio to the ECPL model of ∼3.7 ± 1.5) is beyond the vertical axis scale.
Current usage metrics show cumulative count of Article Views (full-text article views including HTML views, PDF and ePub downloads, according to the available data) and Abstracts Views on Vision4Press platform.
Data correspond to usage on the plateform after 2015. The current usage metrics is available 48-96 hours after online publication and is updated daily on week days.
Initial download of the metrics may take a while.