Open Access
Fig. 6.
Download original image
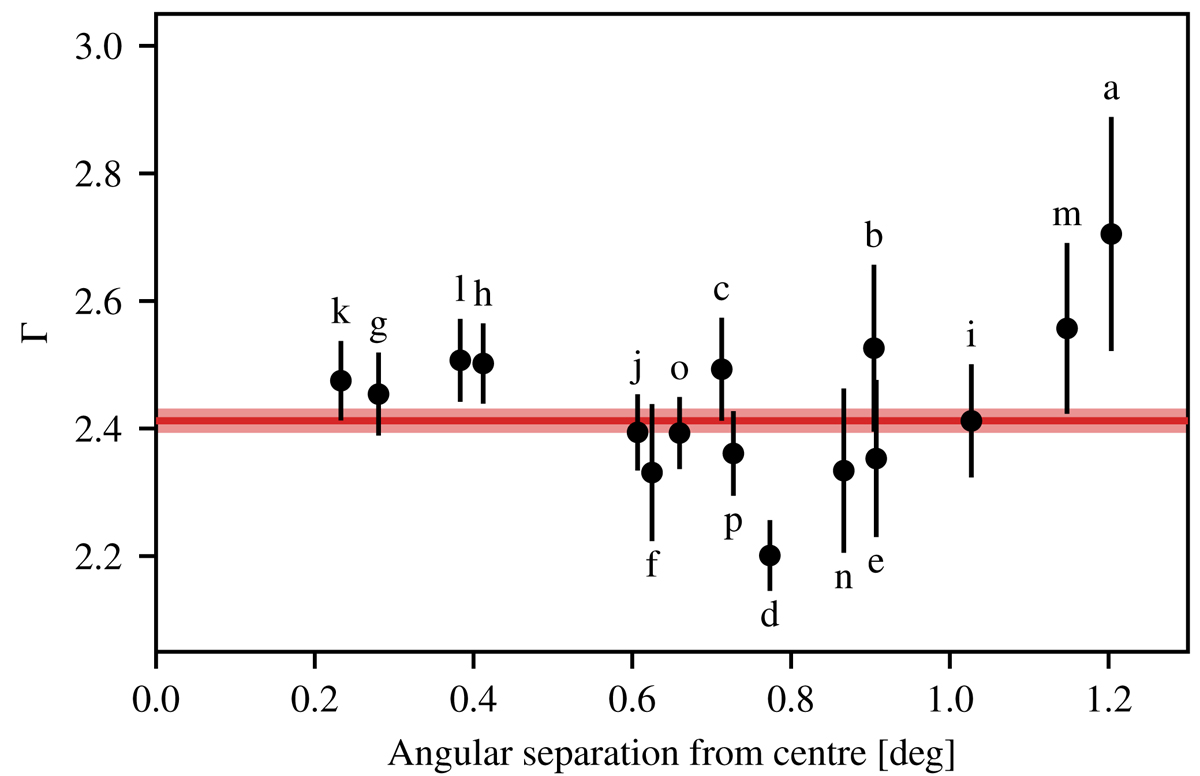
Spectral index Γ for the signal regions a–p, as a function of angular separation between the centre point of each region and the centre point of the total emission (white circle in Fig. 3). The red line and band denote the weighted mean and uncertainty across all regions, ⟨Γ⟩=2.41 ± 0.02, respectively.
Current usage metrics show cumulative count of Article Views (full-text article views including HTML views, PDF and ePub downloads, according to the available data) and Abstracts Views on Vision4Press platform.
Data correspond to usage on the plateform after 2015. The current usage metrics is available 48-96 hours after online publication and is updated daily on week days.
Initial download of the metrics may take a while.