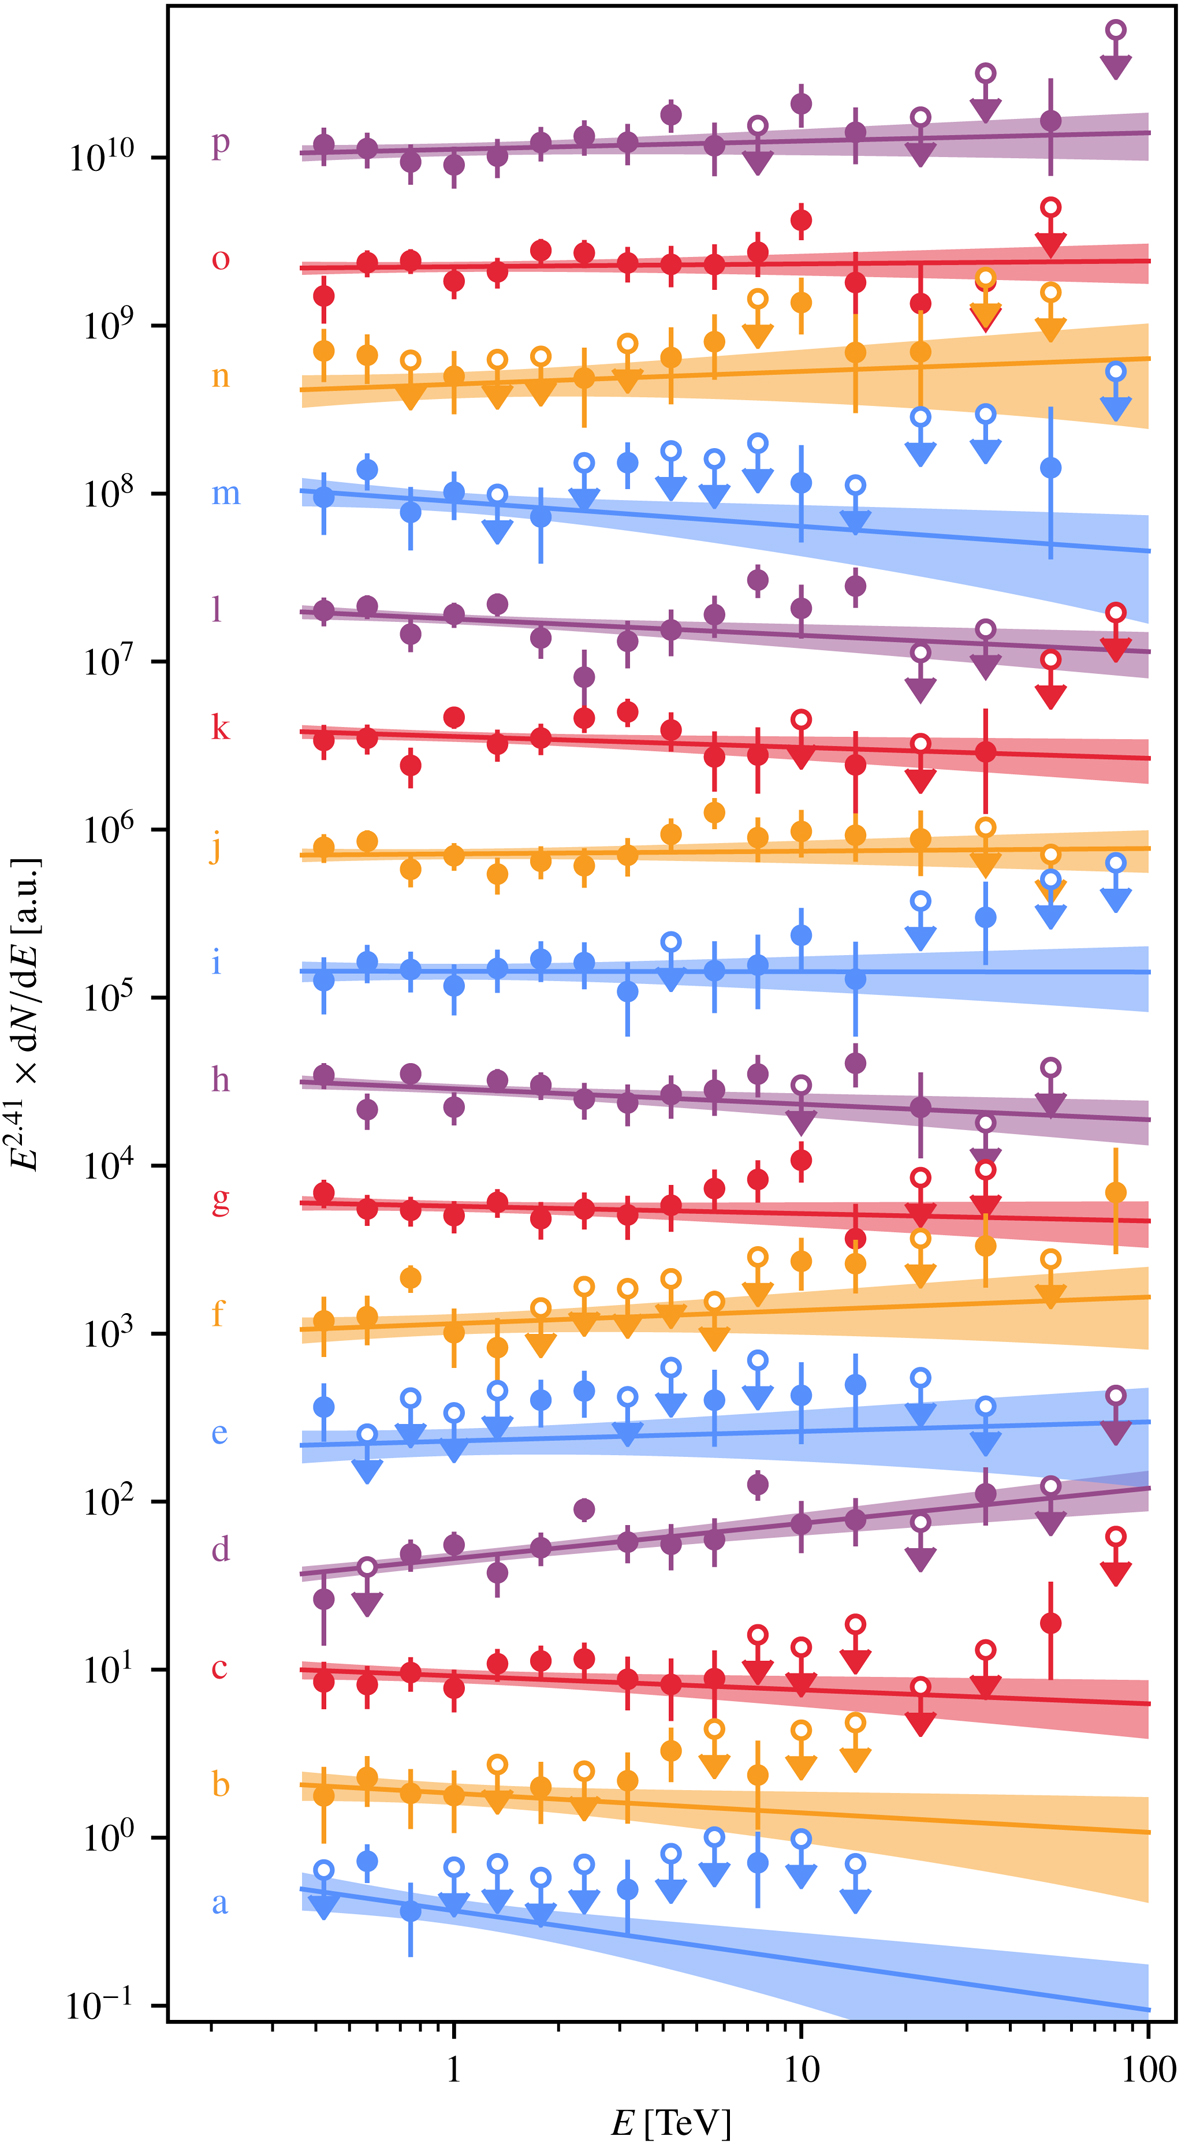
Fig. 5.
Download original image
Comparison of signal region spectra. All spectra were divided (at a reference energy of 1 TeV) by a reference power-law spectrum with spectral index Γ = 2.41, corresponding to the weighted average over all signal regions. Upper limits are at 95% confidence level, and only two upper limits after the last significant (i.e. > 2σ) flux point are shown.
Current usage metrics show cumulative count of Article Views (full-text article views including HTML views, PDF and ePub downloads, according to the available data) and Abstracts Views on Vision4Press platform.
Data correspond to usage on the plateform after 2015. The current usage metrics is available 48-96 hours after online publication and is updated daily on week days.
Initial download of the metrics may take a while.