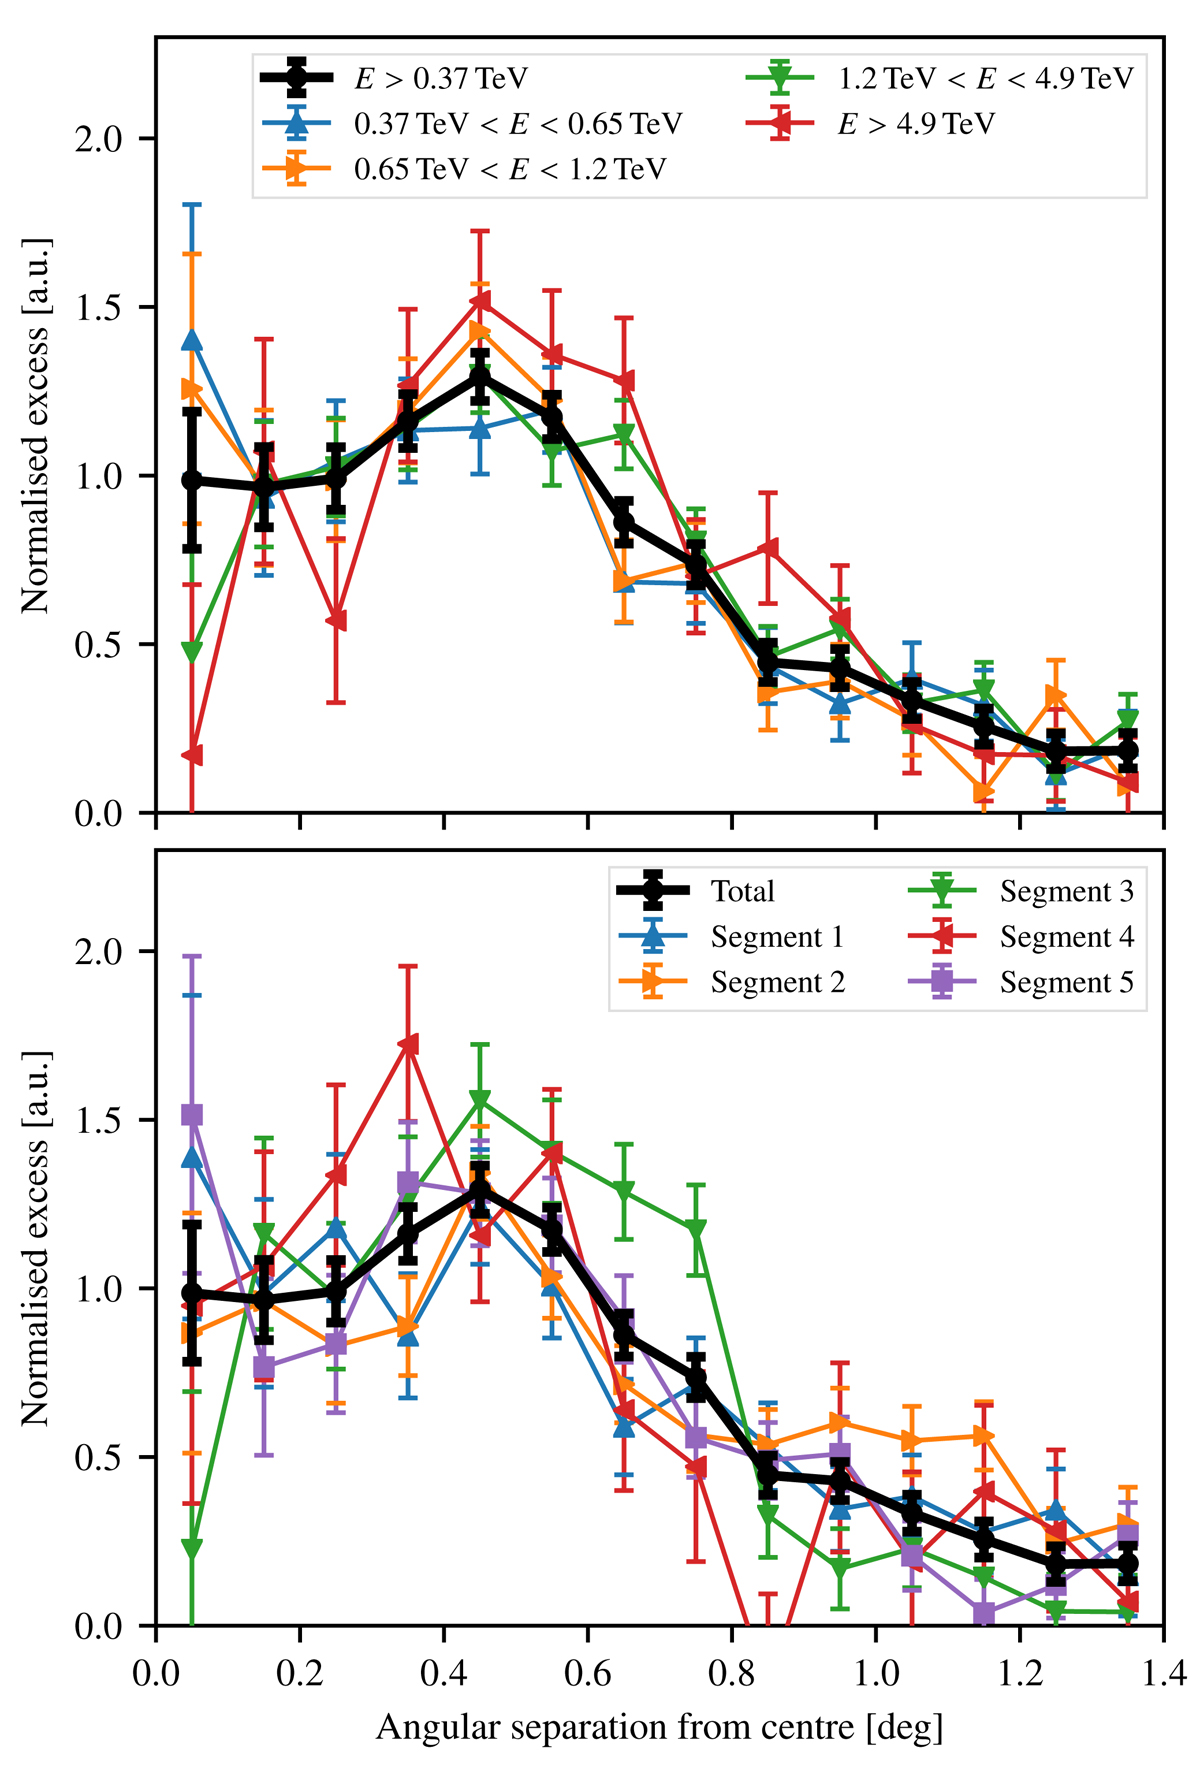
Fig. 4.
Download original image
Radial excess profiles. Shown are exposure-corrected excess counts per unit sky area. Upper panel: profiles for different energy bands. Lower panel: profiles for different segments as defined in Fig. 1b. The black curve, showing the total excess above threshold in all segments, is the same in both panels. All profiles are normalised to equal area, to allow an easy comparison. The profiles have been computed with respect to a centre point at RA 16h46m36s, Dec −46° 01′12″, slightly shifted from the Westerlund 1 position. In the calculation of the profiles, we discarded pixels within 0.6° of the position of HESS J1640−465.
Current usage metrics show cumulative count of Article Views (full-text article views including HTML views, PDF and ePub downloads, according to the available data) and Abstracts Views on Vision4Press platform.
Data correspond to usage on the plateform after 2015. The current usage metrics is available 48-96 hours after online publication and is updated daily on week days.
Initial download of the metrics may take a while.