Fig. 3.
Download original image
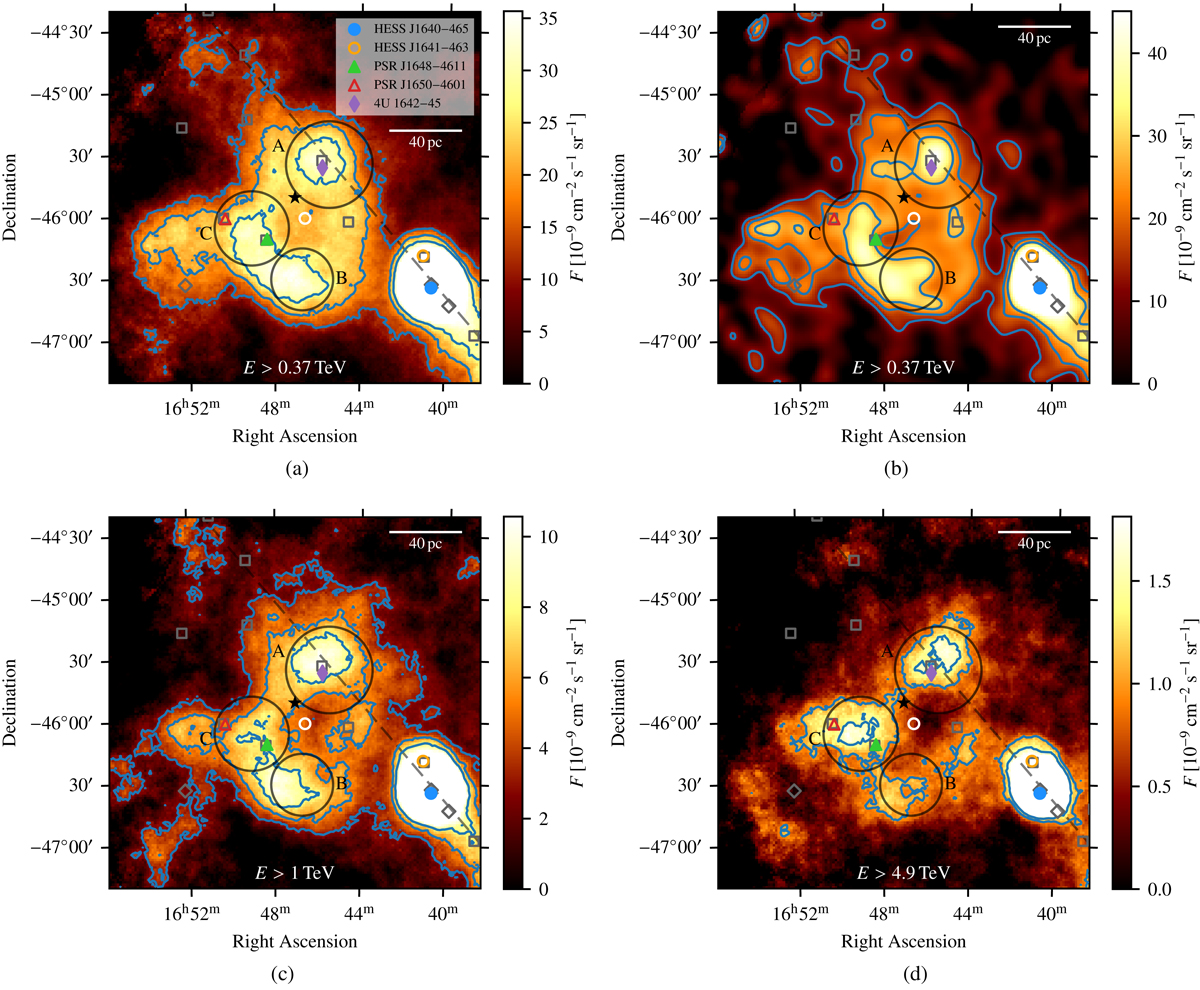
Flux maps of the HESS J1646−458 region. The position of Westerlund 1 is marked by the black star symbol; the grey, dashed line shows the Galactic plane. Coloured symbols indicate objects listed in the legend in panel a. Dark grey square markers denote positions of sources from the 4FGL-DR2 catalogue (Abdollahi et al. 2020; Ballet et al. 2020), where those sources that are still significant (![]() ) above 30 GeV are shown with a diamond marker (◇). Grey circles labelled ‘A’ and ‘B’ mark regions defined in Abramowski et al. (2012); region ‘C’ (at RA 16h49m4.8s, Dec −46° 06′00″) is newly defined here. The white circle marker indicates the coordinate with respect to which the radial profiles in Figs. 4 and 9a have been computed. The scale bar denotes a projected distance of 40 pc, for the nominal distance to Westerlund 1 of 3.9 kpc. The maps are for different energy thresholds, indicated at the bottom of each panel. The maps in panels a, c, and d were computed using a 0.22° top-hat smoothing kernel, while the map in panel b was computed using a 0.07° Gaussian smoothing kernel. Colour scales are saturated at the maximum observed flux value associated with the HESS J1646−458 region. Contour lines shown in blue are at flux levels of F = (12.5/20/27.5)×10−9 cm−2 s−1 sr−1 for panels a and b, at F = (3/5.5/8)×10−9 cm−2 s−1 sr−1 for panel c, and at F = (1/1.5)×10−9 cm−2 s−1 sr−1 for panel d.
) above 30 GeV are shown with a diamond marker (◇). Grey circles labelled ‘A’ and ‘B’ mark regions defined in Abramowski et al. (2012); region ‘C’ (at RA 16h49m4.8s, Dec −46° 06′00″) is newly defined here. The white circle marker indicates the coordinate with respect to which the radial profiles in Figs. 4 and 9a have been computed. The scale bar denotes a projected distance of 40 pc, for the nominal distance to Westerlund 1 of 3.9 kpc. The maps are for different energy thresholds, indicated at the bottom of each panel. The maps in panels a, c, and d were computed using a 0.22° top-hat smoothing kernel, while the map in panel b was computed using a 0.07° Gaussian smoothing kernel. Colour scales are saturated at the maximum observed flux value associated with the HESS J1646−458 region. Contour lines shown in blue are at flux levels of F = (12.5/20/27.5)×10−9 cm−2 s−1 sr−1 for panels a and b, at F = (3/5.5/8)×10−9 cm−2 s−1 sr−1 for panel c, and at F = (1/1.5)×10−9 cm−2 s−1 sr−1 for panel d.
Current usage metrics show cumulative count of Article Views (full-text article views including HTML views, PDF and ePub downloads, according to the available data) and Abstracts Views on Vision4Press platform.
Data correspond to usage on the plateform after 2015. The current usage metrics is available 48-96 hours after online publication and is updated daily on week days.
Initial download of the metrics may take a while.