Fig. 2.
Download original image
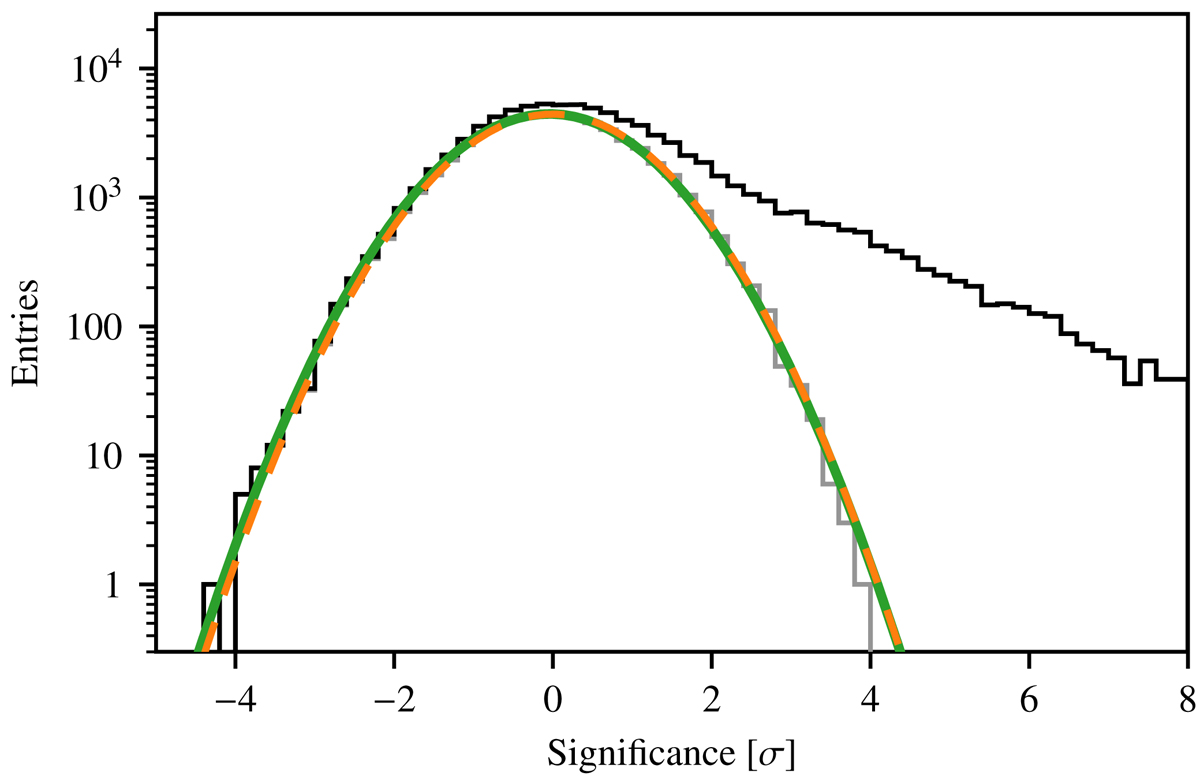
Significance entry distribution. The black histogram corresponds to all pixels of the map shown in Fig. 1a with non-zero entries, the grey histogram to all pixels outside of the final exclusion map. The green line represents the fit of a Gaussian distribution to the grey histogram, the best-fit mean and width are μ = −0.043 ± 0.005 and σ = 1.008 ± 0.005, respectively. A Gaussian distribution with mean μ = 0 and width σ = 1 is shown by the orange, dashed line for comparison.
Current usage metrics show cumulative count of Article Views (full-text article views including HTML views, PDF and ePub downloads, according to the available data) and Abstracts Views on Vision4Press platform.
Data correspond to usage on the plateform after 2015. The current usage metrics is available 48-96 hours after online publication and is updated daily on week days.
Initial download of the metrics may take a while.