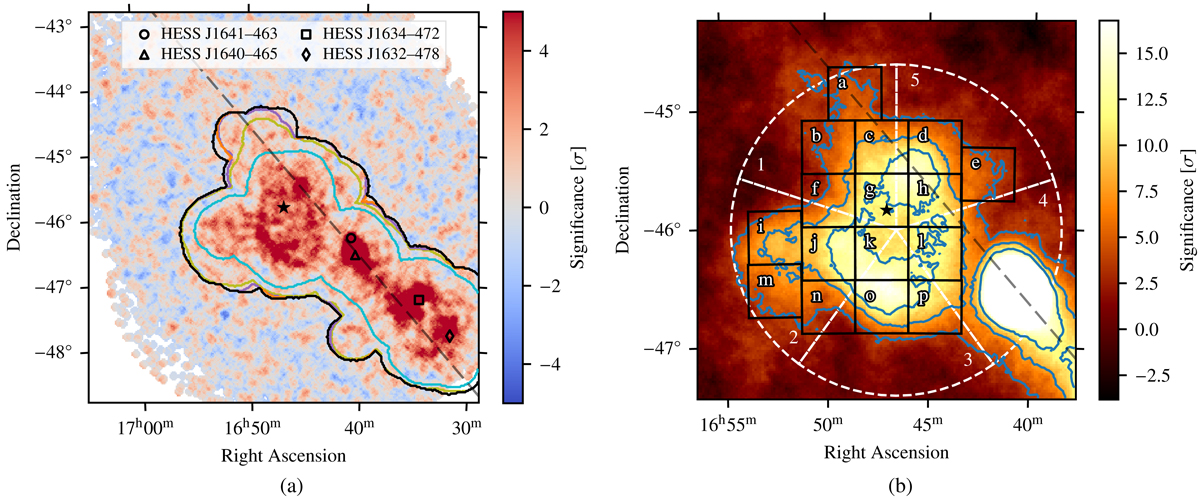
Fig. 1.
Download original image
Significance maps after background subtraction. The position of Westerlund 1 is marked by the black star symbol; the grey, dashed line shows the Galactic plane. a: map for the entire 6° ×6° region of interest, smoothed with a 0.07° top-hat kernel. The final exclusion map is shown in black, earlier iterations in blue, green, purple, and orange. Locations of previously detected sources that are not connected to HESS J1646−458 are indicated by black, open symbols. b: map with detail view of the emission surrounding Westerlund 1, smoothed with a 0.22° top-hat kernel. The colour scale is saturated at the maximum observed significance value associated with the HESS J1646−458 region. Contour lines corresponding to a significance of 4, 8, and 12σ are shown in blue. Signal regions a–p used for spectrum extraction are overlaid (black), as are segments 1–5 for the computation of radial profiles (white dashed).
Current usage metrics show cumulative count of Article Views (full-text article views including HTML views, PDF and ePub downloads, according to the available data) and Abstracts Views on Vision4Press platform.
Data correspond to usage on the plateform after 2015. The current usage metrics is available 48-96 hours after online publication and is updated daily on week days.
Initial download of the metrics may take a while.