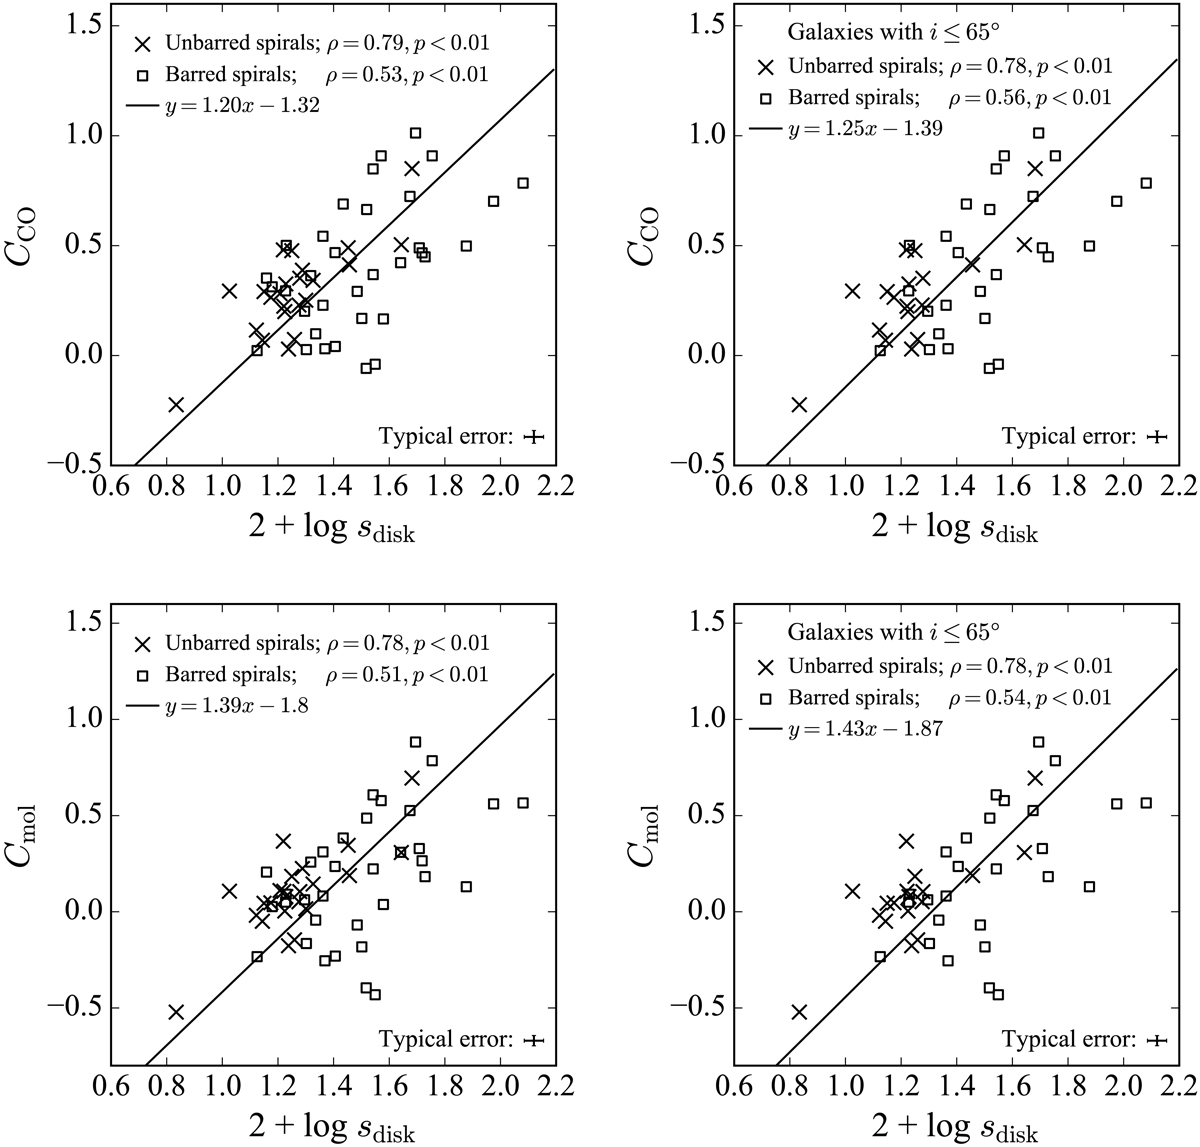
Fig. 8.
Download original image
Dependence of CO luminosity concentrations (CCO) and molecular gas concentrations (Cmol) on the strengths of disk structure (2 + log sdisk). The left two panels show the results for the parent sample, whereas the right two panels show the results for galaxies with i ≤ 65°. The formulas indicate linear fits considering both barred and unbarred galaxies. They are derived using PCA and marked with solid lines. The Pearson correlation coefficients, ρ, for unbarred and barred galaxies are given at the top of each panel.
Current usage metrics show cumulative count of Article Views (full-text article views including HTML views, PDF and ePub downloads, according to the available data) and Abstracts Views on Vision4Press platform.
Data correspond to usage on the plateform after 2015. The current usage metrics is available 48-96 hours after online publication and is updated daily on week days.
Initial download of the metrics may take a while.