Fig. 3.
Download original image
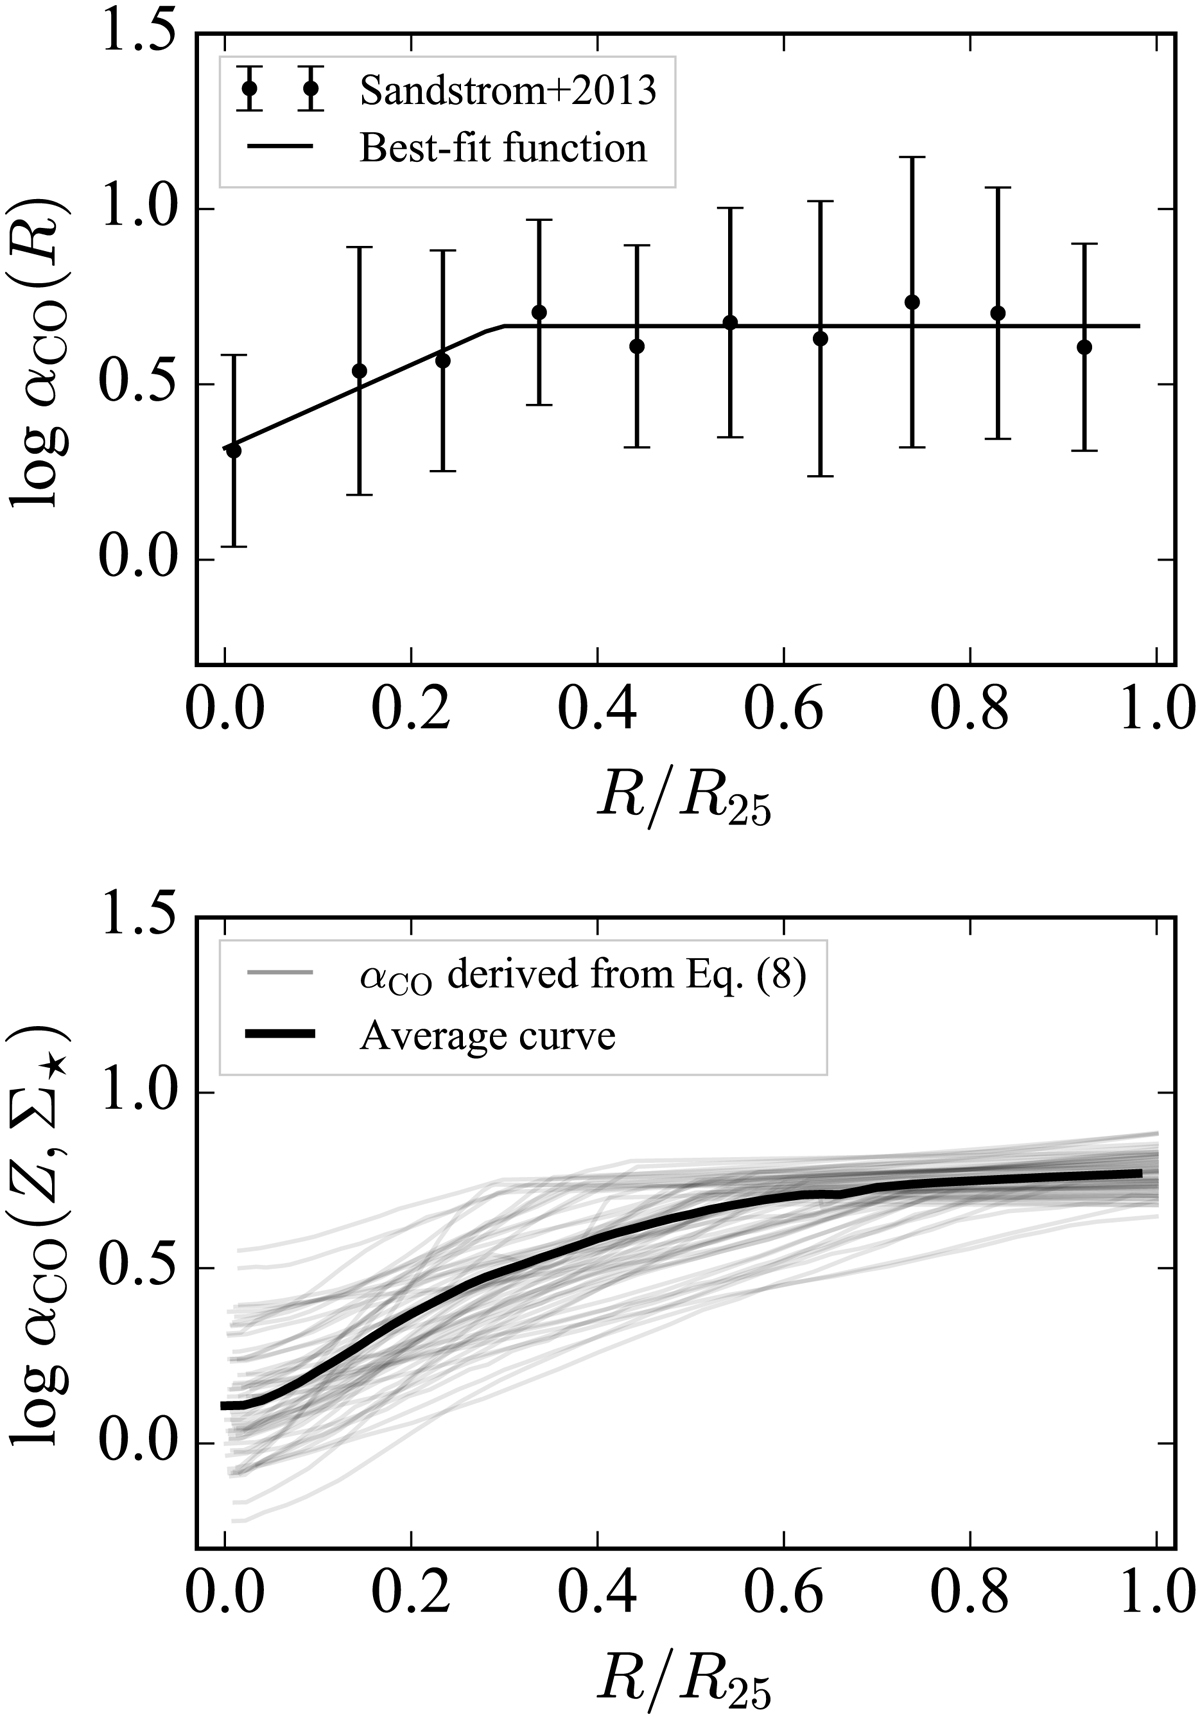
αCO plotted against galactocentric radius normalized by R25. Top panel:αCO(R) obtained by multiplying the empirical normalized average profile of αCO adopted from Sandstrom et al. (2013) by Milky Way αCO, MW = 4.4 M⊙ pc−2 (K km s−1)−1; the errors are also from Sandstrom et al. (2013) and the black curve is the best-fit function. Bottom panel:αCO(Z, Σ⋆), marked in gray, derived from Eq. (8), which considers the decrease in αCO driven by higher metallicity (Z) and stellar surface density (Σ⋆); the black curve denotes the mean αCO for a given radius.
Current usage metrics show cumulative count of Article Views (full-text article views including HTML views, PDF and ePub downloads, according to the available data) and Abstracts Views on Vision4Press platform.
Data correspond to usage on the plateform after 2015. The current usage metrics is available 48-96 hours after online publication and is updated daily on week days.
Initial download of the metrics may take a while.