Fig. 7.
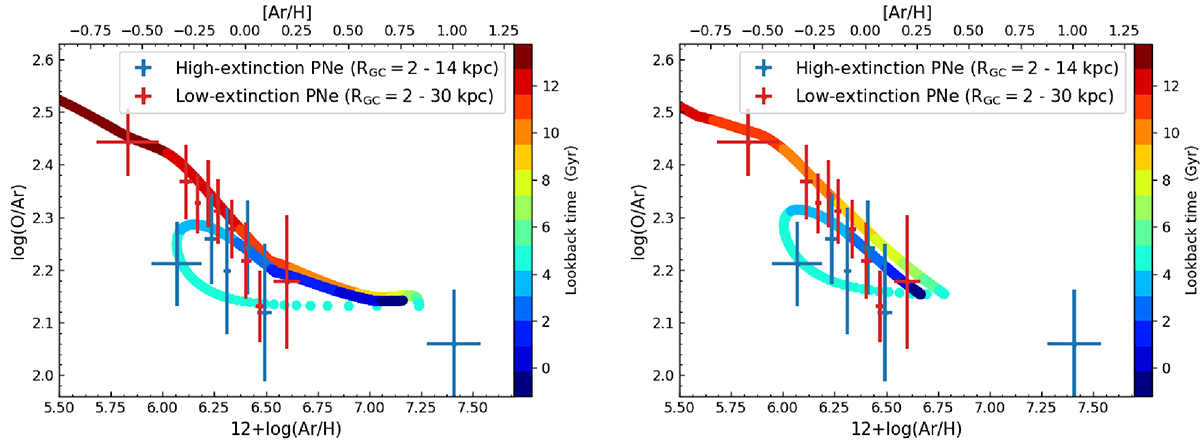
Download original image
Mean log(O/Ar) values of the low-extinction PNe (red) over the 2–30 kpc radial range, the high-extinction PNe (blue) within RGC < 14 kpc, and the new two-infall chemical evolution model for the M31 disc (see Sect. 4.2 for details), coloured by lookback time: the fiducial model on the left and the alternative model with a weaker first star formation on the right. The [Ar/H] abundances with respect to the solar values are marked on the top and right axes, respectively. More details on the chemical evolution models are provided in Appendix B.
Current usage metrics show cumulative count of Article Views (full-text article views including HTML views, PDF and ePub downloads, according to the available data) and Abstracts Views on Vision4Press platform.
Data correspond to usage on the plateform after 2015. The current usage metrics is available 48-96 hours after online publication and is updated daily on week days.
Initial download of the metrics may take a while.