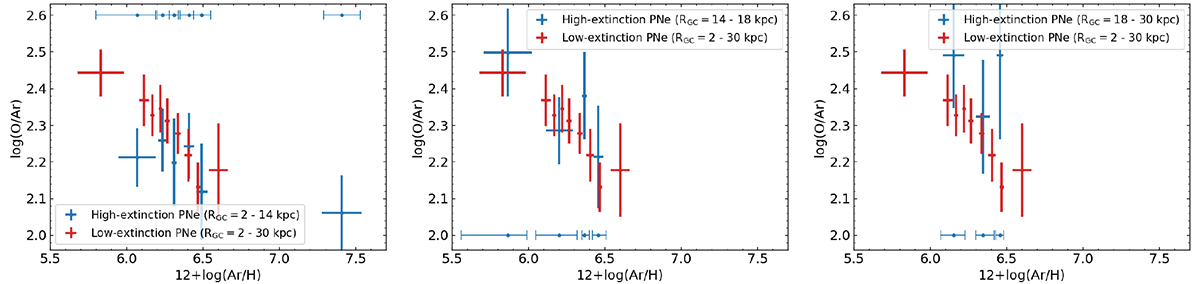
Fig. 6.
Download original image
Same as Fig. 3, showing the mean log(O/Ar) values of the high- (blue) and low- (red) extinction PNe, but now showing only high-extinction PNe in the inner disc (RGC < 14 kpc; left), in the starburst region (14 ≤ RGC ≤ 18 kpc; middle), and in the outer disc (RGC > 18 kpc; right). The blue error bars parallel to the x axis indicate the width of the bins in 12 + log(A/H) for the high-extinction (blue) PN sub-samples in the different annuli.
Current usage metrics show cumulative count of Article Views (full-text article views including HTML views, PDF and ePub downloads, according to the available data) and Abstracts Views on Vision4Press platform.
Data correspond to usage on the plateform after 2015. The current usage metrics is available 48-96 hours after online publication and is updated daily on week days.
Initial download of the metrics may take a while.