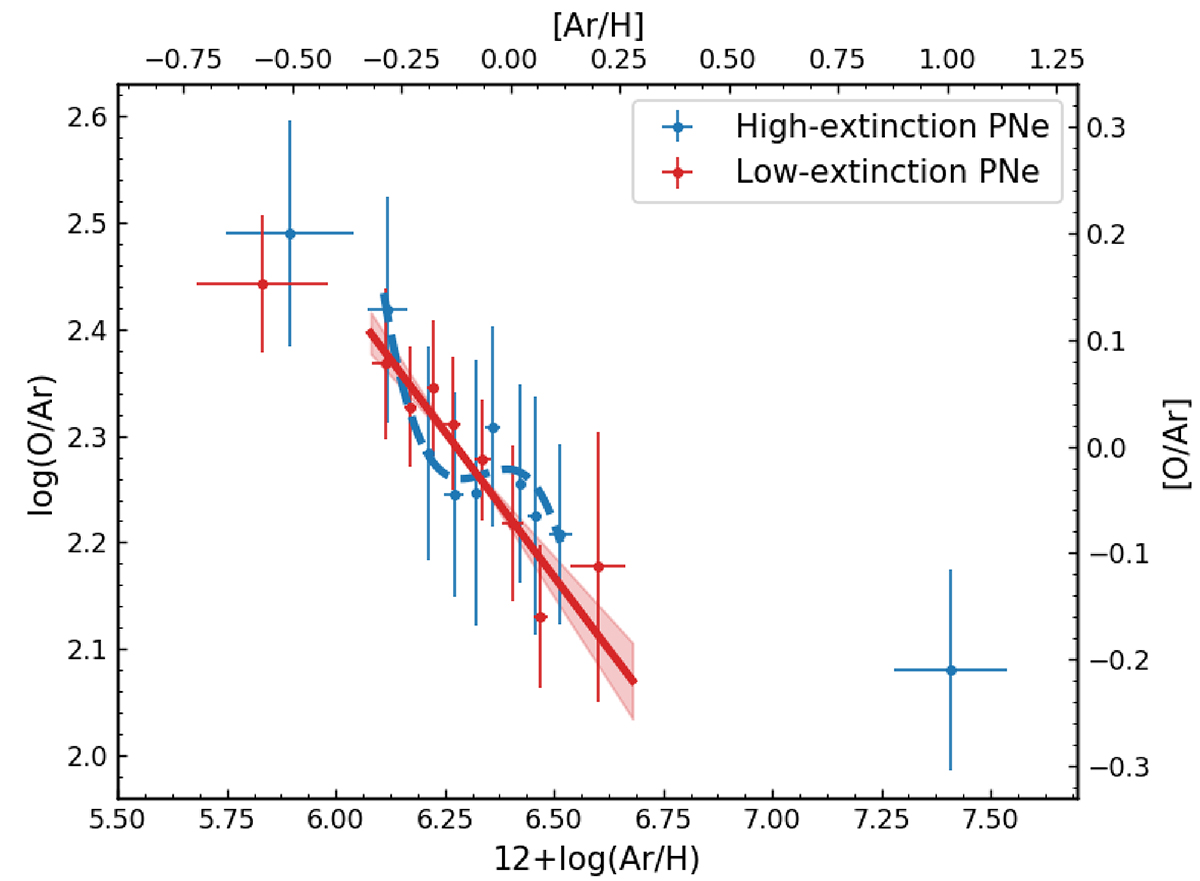
Fig. 5.
Download original image
Same as Fig. 3, showing the mean log(O/Ar) values of the high- (blue) and low- (red) extinction PNe but now also showing the linear fit with uncertainty shaded for the low-extinction sample. For the high-extinction PNe, the dashed blue line shows a third-order polynomial curve that better fits the lower mean log(O/Ar) values of the high-extinction PNe in the 12 + log(Ar/H) = 6.1–6.3 range. The [Ar/H] abundances and [O/Ar] ratios with respect to the solar values are marked on the top and right axes, respectively.
Current usage metrics show cumulative count of Article Views (full-text article views including HTML views, PDF and ePub downloads, according to the available data) and Abstracts Views on Vision4Press platform.
Data correspond to usage on the plateform after 2015. The current usage metrics is available 48-96 hours after online publication and is updated daily on week days.
Initial download of the metrics may take a while.