Fig. 3.
Download original image
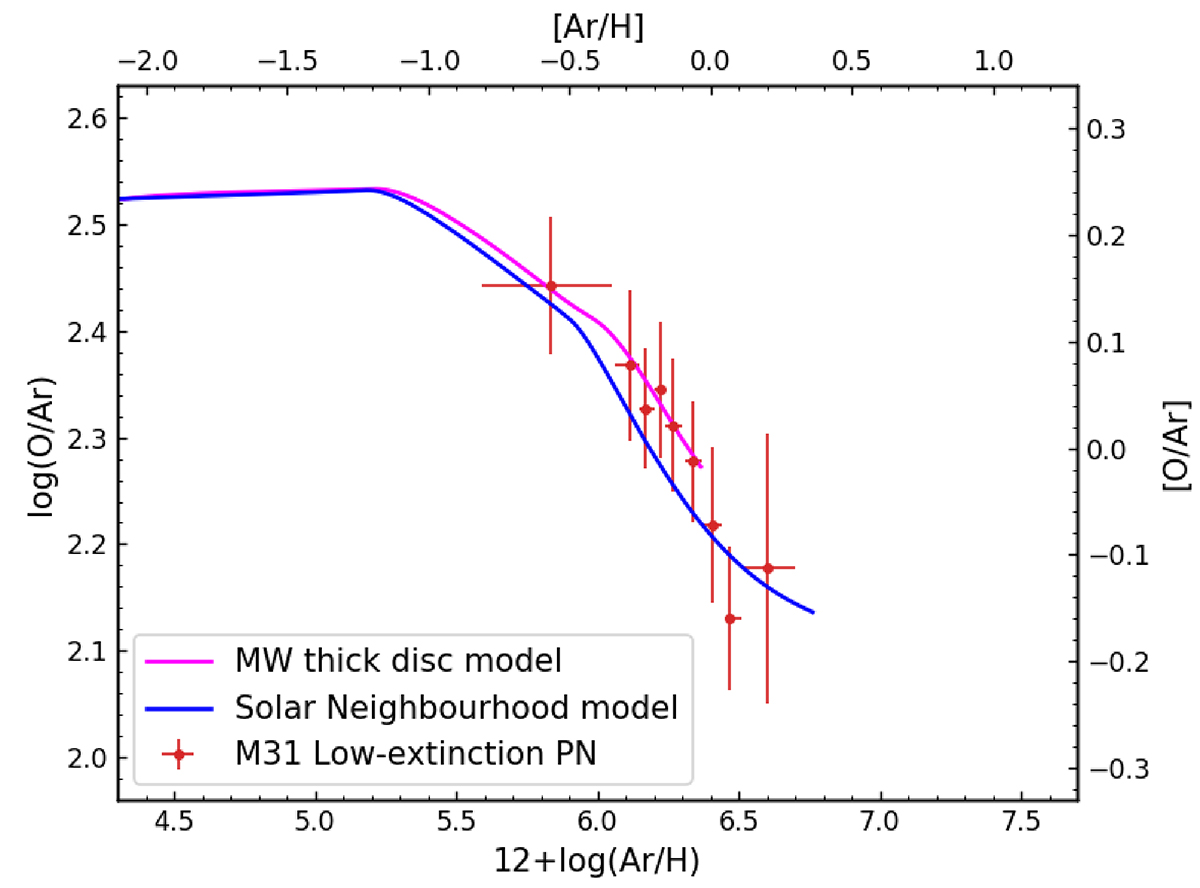
Log(O/Ar) values for the low-extinction PNe in M31 binned as a function of their 12 + log(Ar/H) values and shown as red symbols; for each bin the mean log(O/Ar) is plotted along with the sigma-clipped error. The continuum lines reproduce the chemical evolution tracks for the oxygen and argon elements modelled by Kobayashi et al. (2020a) for the MW thick disc (magenta) and the solar neighbourhood (dark blue). The [Ar/H] abundances and [O/Ar] ratios with respect to the solar values (12 + log(Ar/H)⊙ = 6.38 and log(O/Ar)⊙ = 2.29) are marked on the top and right axes, respectively.
Current usage metrics show cumulative count of Article Views (full-text article views including HTML views, PDF and ePub downloads, according to the available data) and Abstracts Views on Vision4Press platform.
Data correspond to usage on the plateform after 2015. The current usage metrics is available 48-96 hours after online publication and is updated daily on week days.
Initial download of the metrics may take a while.