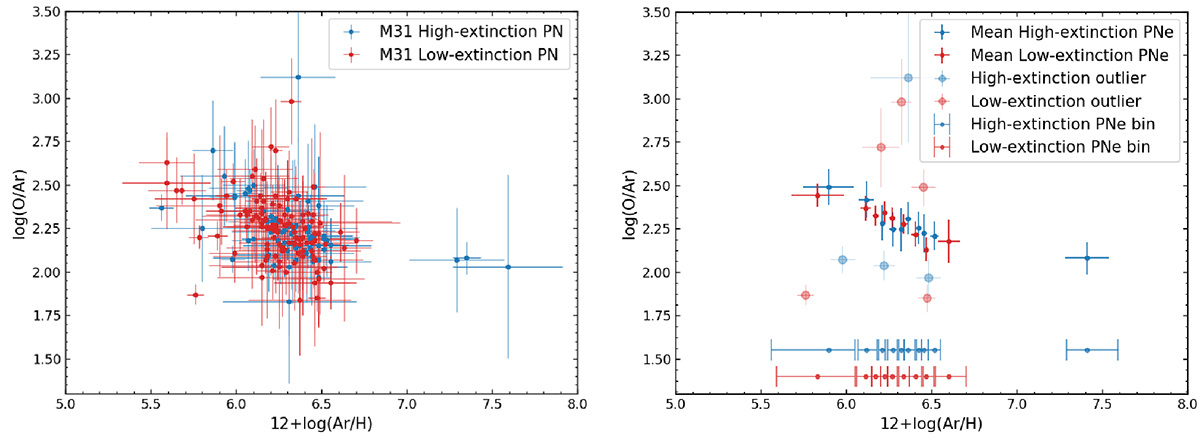
Fig. 2.
Download original image
The M31 PN distribution in the log(Ar/O) versus 12 + log(Ar/H) plane. Left: oxygen-to-argon abundance ratio, log(Ar/O), plotted against argon abundance for the high- (blue) and low- (red) extinction PNe in M31. Right: high- (blue) and low- (red) extinction PNe binned separately as a function of their 12 + log(Ar/H) values. For each bin the sigma-clipped mean log(O/Ar) is plotted along with its error (error bar along the y axis; see Sect. 3.1). The error is computed as the error on the mean log(O/Ar) value added in quadrature to the mean observation error of the PNe that remain in each bin, after the sigma-clipping. Clipped PNe with log(O/Ar) values that are more than 2 sigma beyond the mean values are marked with a lighter shade. Error bars along the x axis capture the rms of PNe in each argon abundance bin. Red and blue error bars parallel to the x axis indicate the width of the bins in 12 + log(Ar/H) for the low-extinction (red) and high-extinction (blue) PN samples.
Current usage metrics show cumulative count of Article Views (full-text article views including HTML views, PDF and ePub downloads, according to the available data) and Abstracts Views on Vision4Press platform.
Data correspond to usage on the plateform after 2015. The current usage metrics is available 48-96 hours after online publication and is updated daily on week days.
Initial download of the metrics may take a while.